ジャン=エマニュエル・デ・ネーヴ教授による『職場のウェルビーイングに関する世界最大の研究から得た洞察』日本語訳/英語です。
Professor Jan-Emmanuel De Neve: Insights from the World’s Largest Study on Workplace Wellbeing
2023.05.26
WORLD HAPPINESS SUMMIT
WOHASU® EST.
目次
1. 日本語訳

紹介をありがとうございます。今日、皆さんと一緒に過ごせることは素晴らしいことです。また、職場のウェルビーイングに関する世界最大の研究のいくつかの洞察を共有できることは大変うれしいです。
1. はじめに
このプロジェクトは過去3年間、研究し進めてきたものです。得た洞察と学びについて、画面に表示されている4つの実証的な質問を中心に構造化してご紹介いたします。

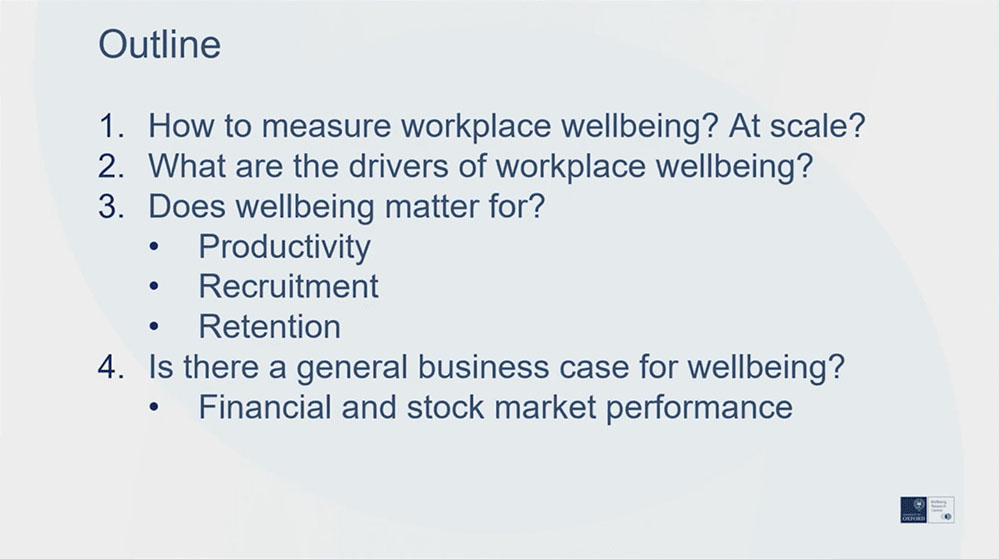
まず最初に、以下についてお話しします。
・ 職場のウェルビーイングをどのように測定するのか
・どのように前例にないスケールでそれを実践するのか
・データが私たちに伝えてくれること
・人々の職場での感じ方やその相対的な重要性
また、私たちの研究にも触れてみます。
・生産性に対する従業員のウェルビーイングがどのように重要であるか
・どのように才能を引き寄せるか、人材を保持する際の影響
次の20分間でこれらすべてをまとめ、従業員のウェルビーイングが組織レベルで職場のパフォーマンスにどのような影響を及ぼすかを考えてみたいと思います。その際、
・市場の金融市場の結果や株式市場のパフォーマンスも適用します。
お察しの通り、この20分間は多くのことをお伝えしなければならず、非常に限られた時間内に多くの資料を用意しています。ですので、資料を急いでご紹介しているように感じられるかもしれませんが、実際急いでおります。お許しいただきつつ、この素晴らしい2日間を通じて、この資料の一部をより深く掘り下げて議論できることを願っています。
また学者として、各スライドに参考文献を記載しました。もし素材の一部をもっと深く掘り下げたい場合は、多くはオンラインで入手可能であり、近いうちに出版も予定しています。
2. 職場のウェルビーイング測定法
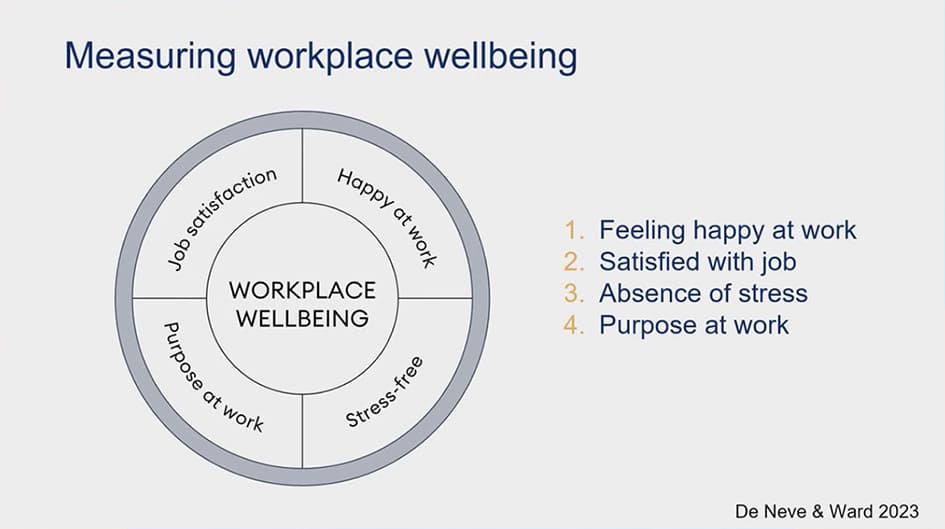
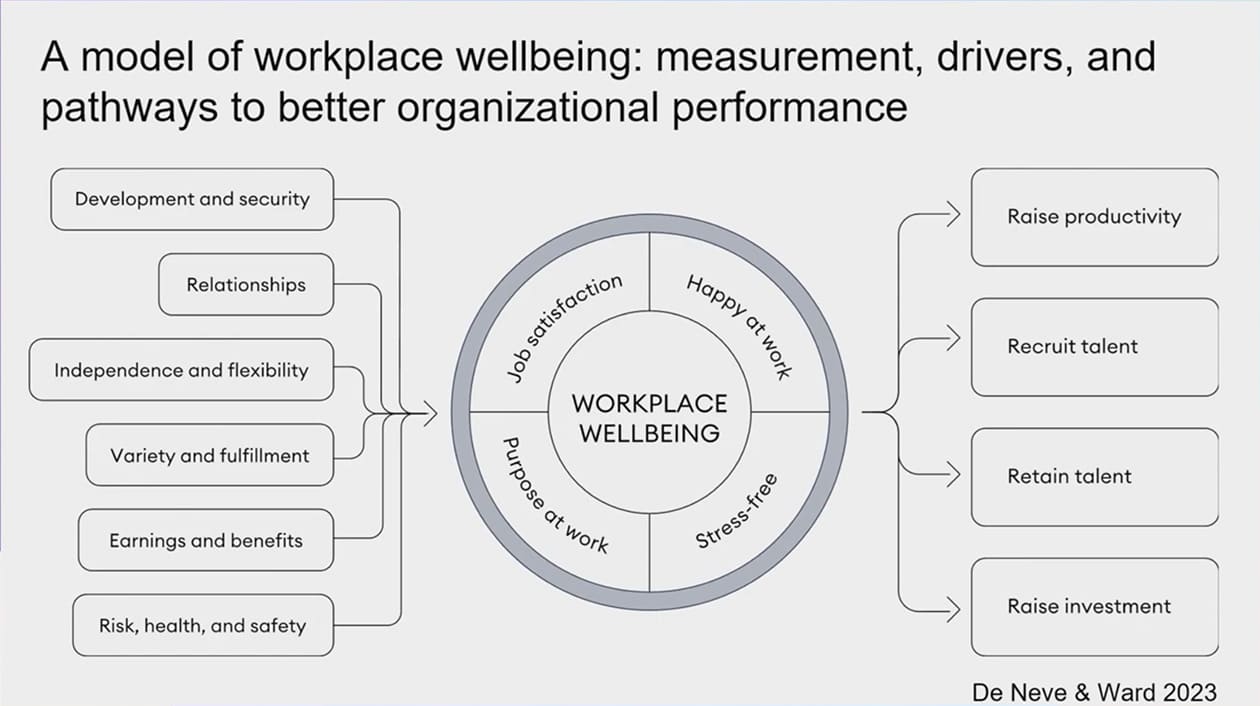
さて。さらなる前置きなしに、実際に職場のウェルビーイングをどのように測定するか?の問いに取りかかりましょう。まず、これを行う唯一の方法は、人々に尋ねることです。そして、この世界最大の研究で尋ねる方法は、人々が以下の四項目でどのように感じているか、ということです。
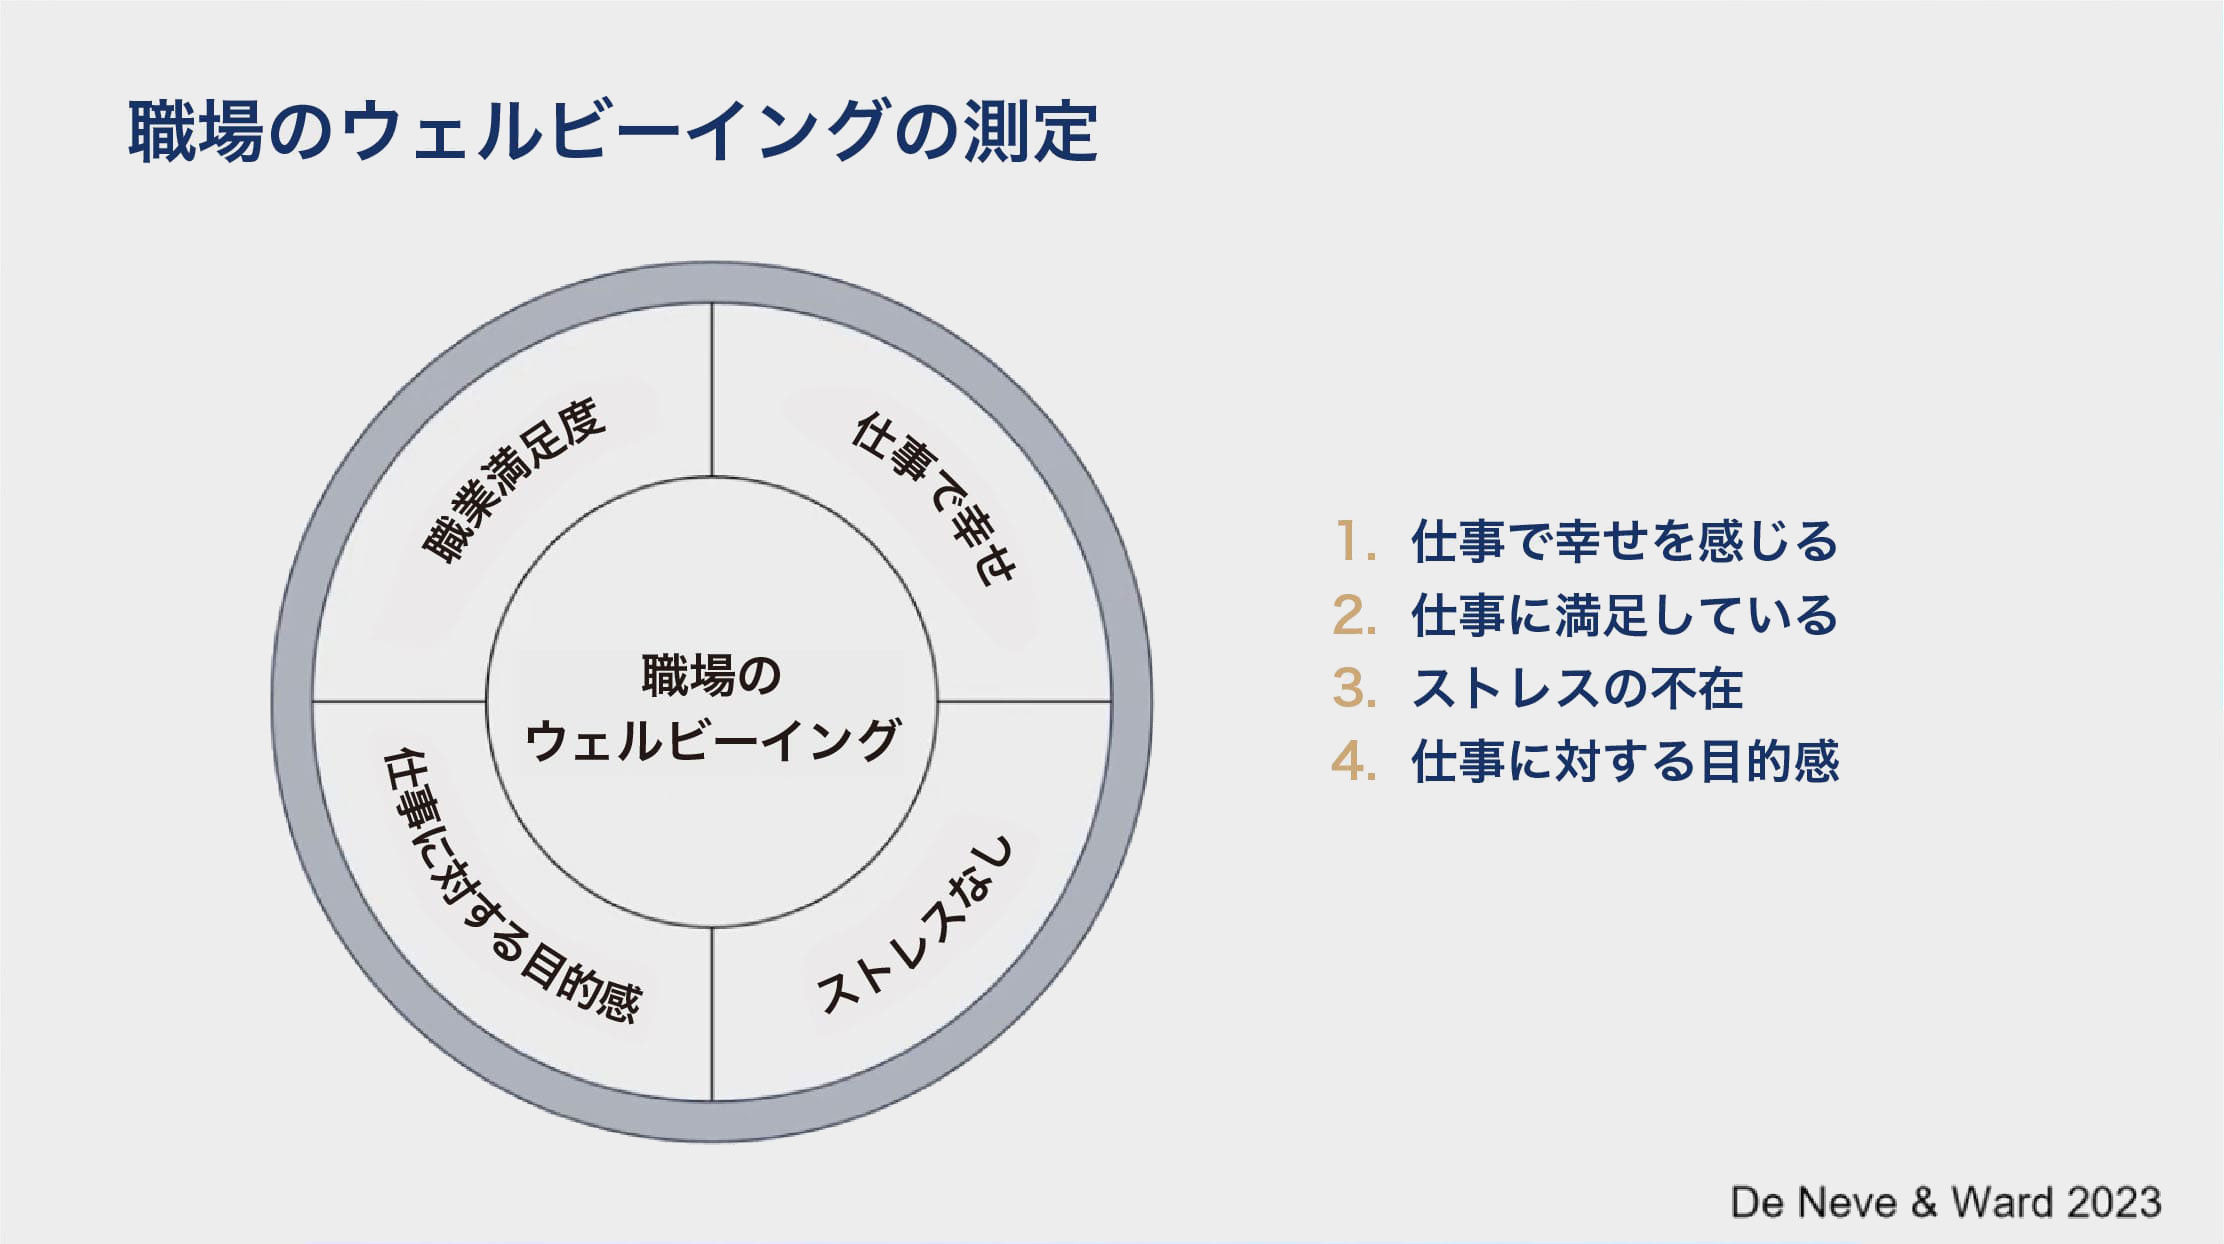
1. 職場で幸せを感じているか。
2. 仕事に満足しているか。
3. ネガティブなストレッサー(ストレスの原因となる要因)を経験しているか。
4. 職場で目的を見つけているか。
これらが結合して、人々が職場でどのように感じているかを全体的に示します。
ここにいるほとんどの専門家の皆様は、この四項目がOECDが提案する一般的なウェルビーイングの測定と一致していることに気付かれるでしょう。特に、英国国内統計で一般的なウェルビーイングを測定するための四項目が、イングランドやイギリスの他の地域のウェルビーイング測定に使用されています。
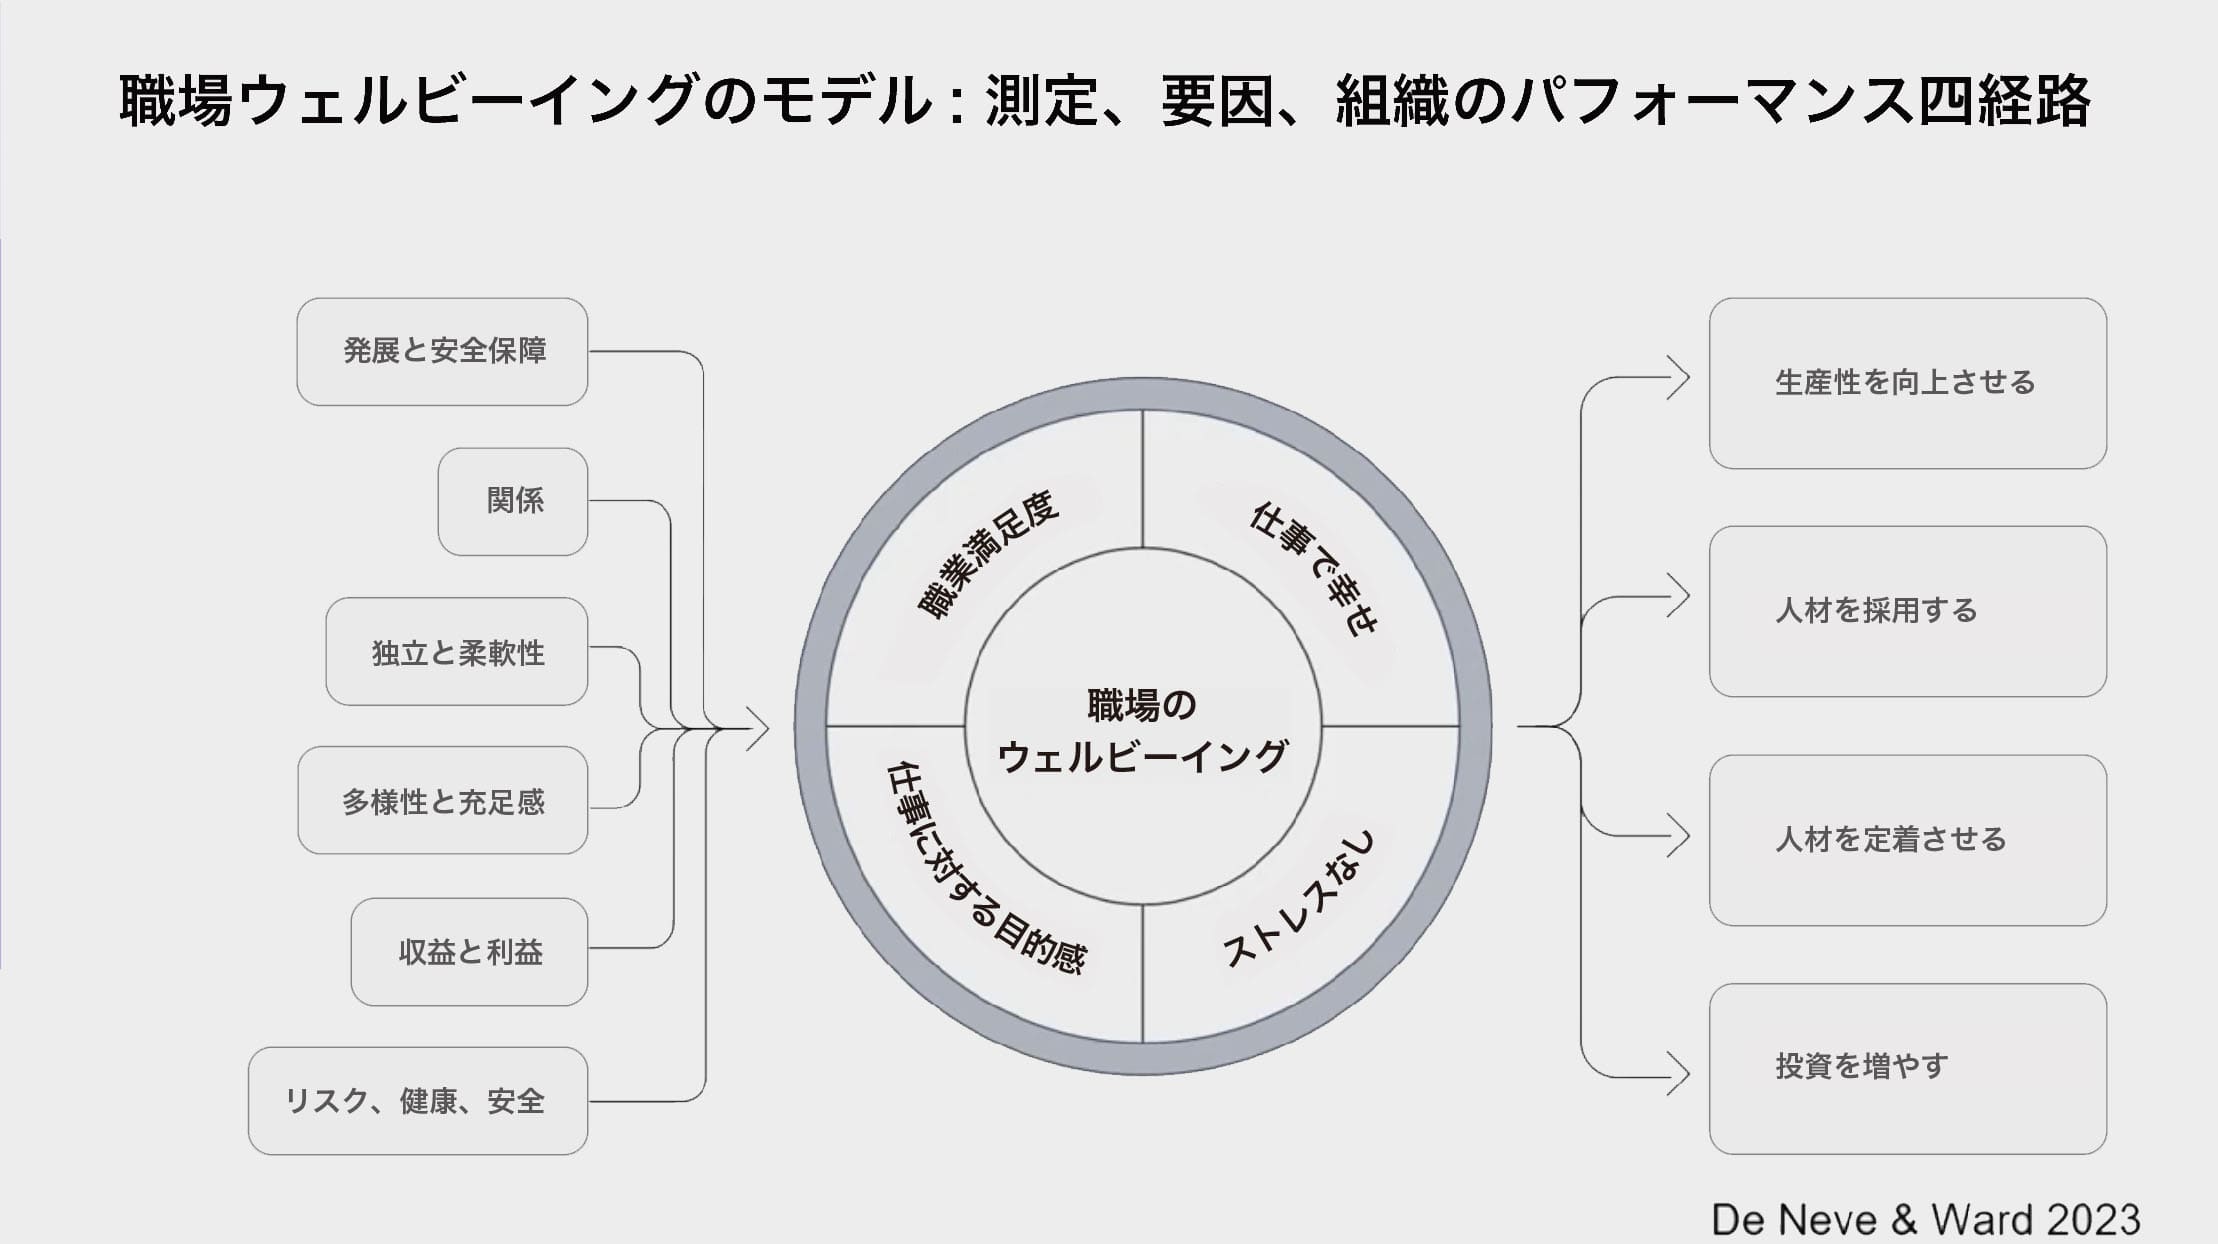
また、仕事の結果の尺度、つまり「人々が職場でどのように感じるか」を「それをどうやって感じるか」「なぜそのように感じるのか」という観点から概念的に分ける重要性を強調したいと思います。これらは、より適した「要因」として考えるべきです。また、「結果」の測定の観点から職場のウェルビーイングを概念的に強調します。
つまり、以下の点を明確に分ける重要性を強調します。
⚫︎人々が職場でどのように感じているか。
⚫︎どのように感じているかの理由(なぜそのように感じるのか)。
これらは、より適した理由として考えるべき要素です。
社会的なつながり、管理のサポート、公平な給与などを考える際、これらは「要因」として考慮すべきです。これらの要因が、職場のウェルビーイングの「結果」に肯定的な影響を与えることを期待しています。
また、ウェルビーイングの「結果」である職場での感情や気分を理解する際に
・どうしてそのような気分になるのか
・なぜそのように感じるのか
概念的に区別する重要性も強調したいと思います。これらは適切に「要因」として考えるべきです。
社会的なつながりや管理のサポート、公平な給与を考える際、これらはウェルビーイングの「結果」としての感情や気分に肯定的な影響を与える可能性がある「要因」として考慮すべきです。これらがいかに重要であるかがわかるでしょう。
さて、これらを前例のない規模で、どのように測定するのでしょうか?素晴らしいパートナーが必要です。そのパートナーが、世界最大の求人検索プラットフォームです。
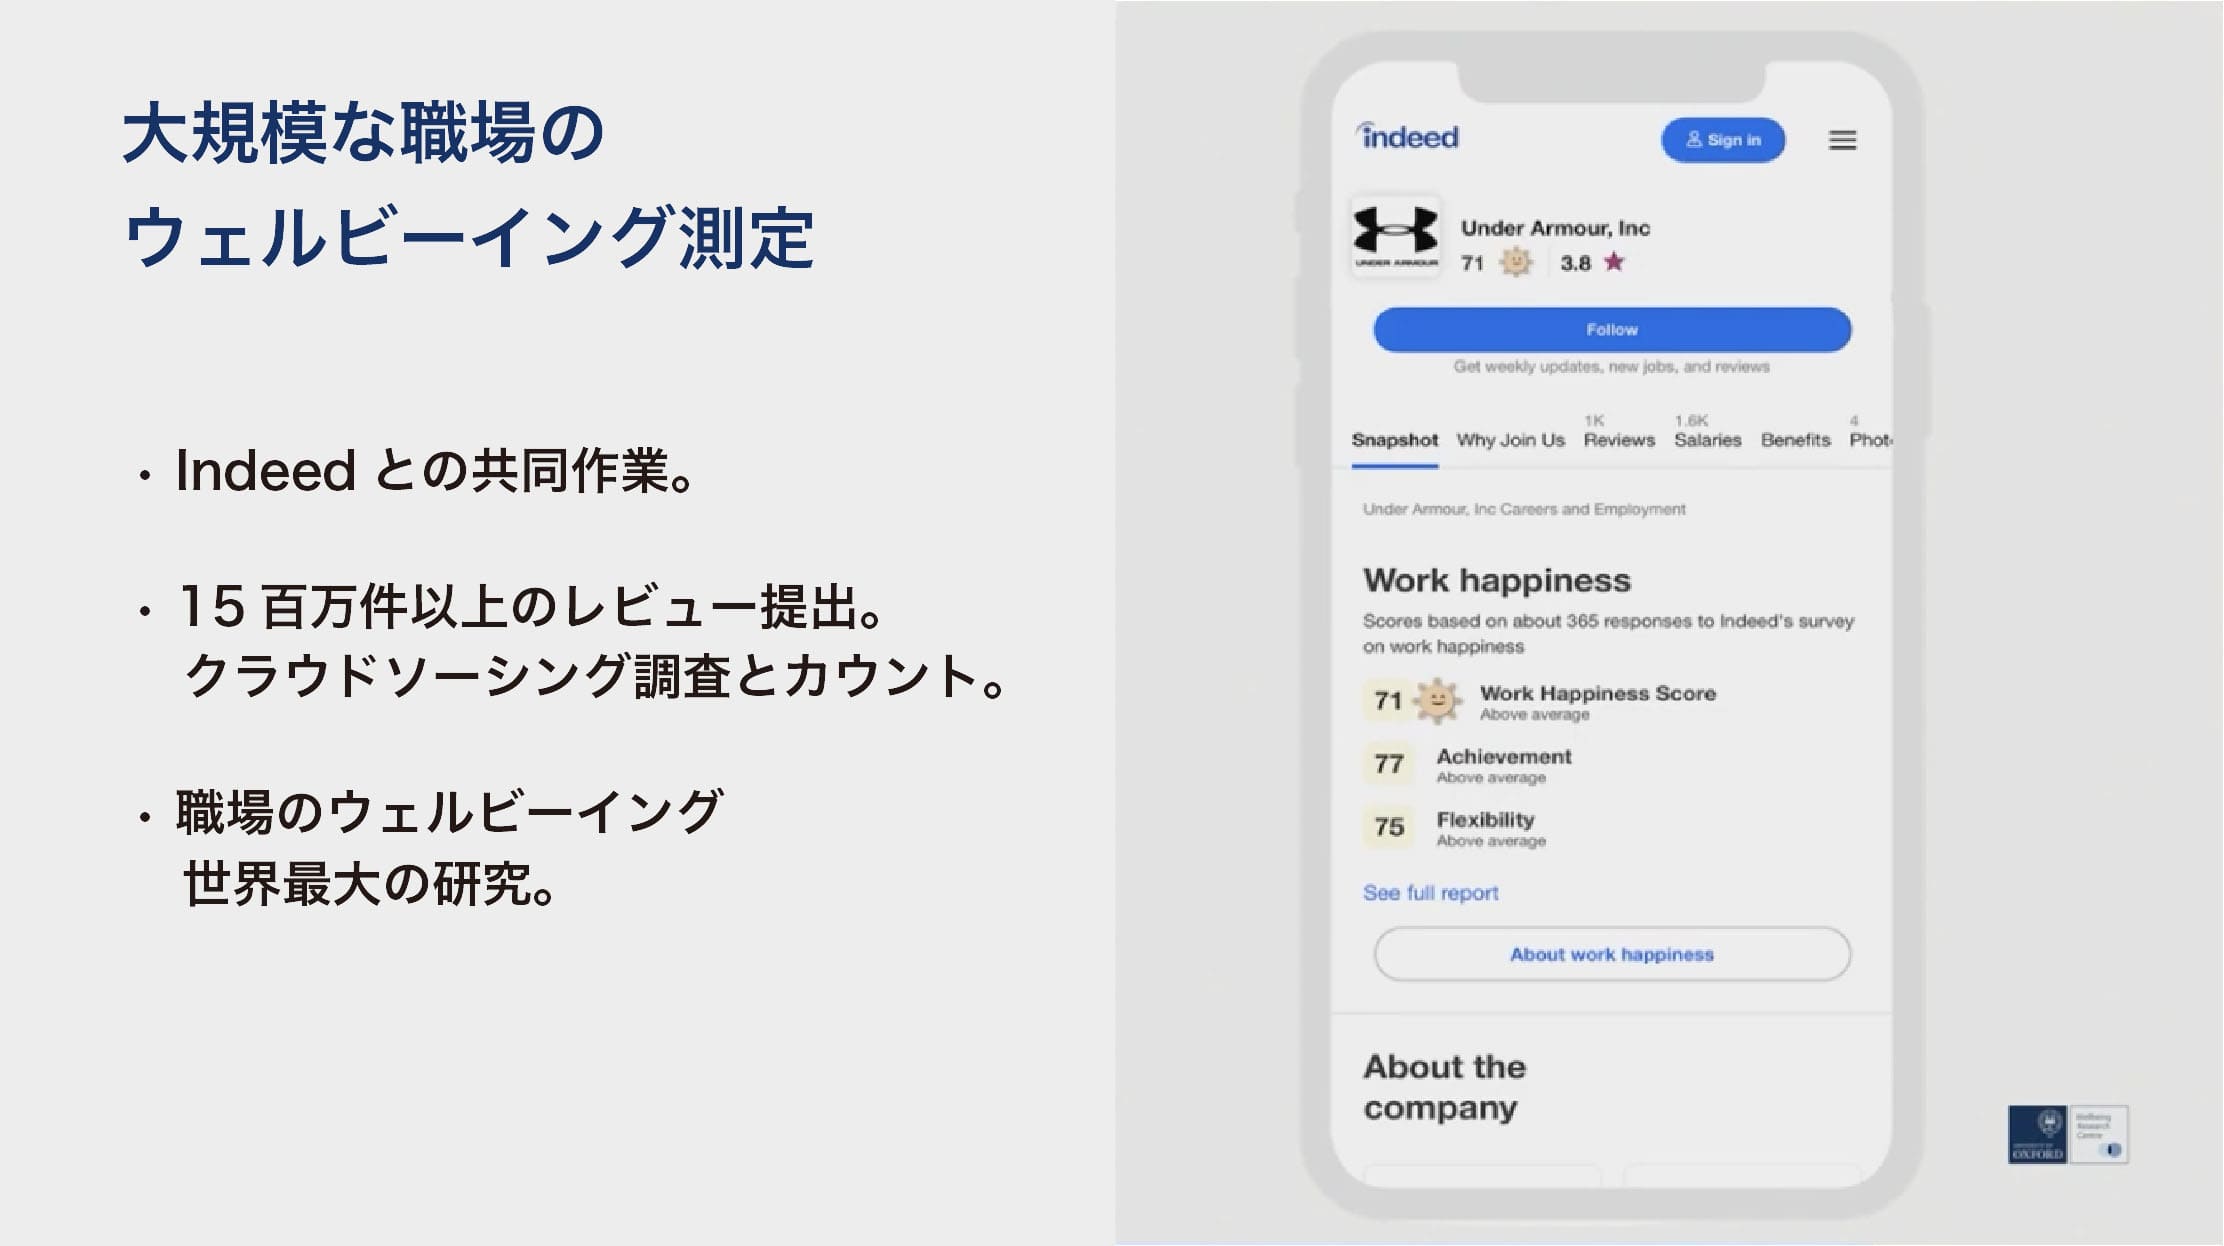
毎月、約2億5000万人がウェブサイトを訪れる流れを利用して、アンケート調査と回答をクラウドソーシングできるのが規模拡大の鍵です。
この大規模な取り組みの結果、3年未満で1500万以上の企業レビューをクラウドソーシングしました。これにより、個人が雇用主や前雇用主について、どのように感じているかがわかります。これは20の市場で実施されており、現在は米国のデータが多く利用可能です。そして、本日使用するデータです。
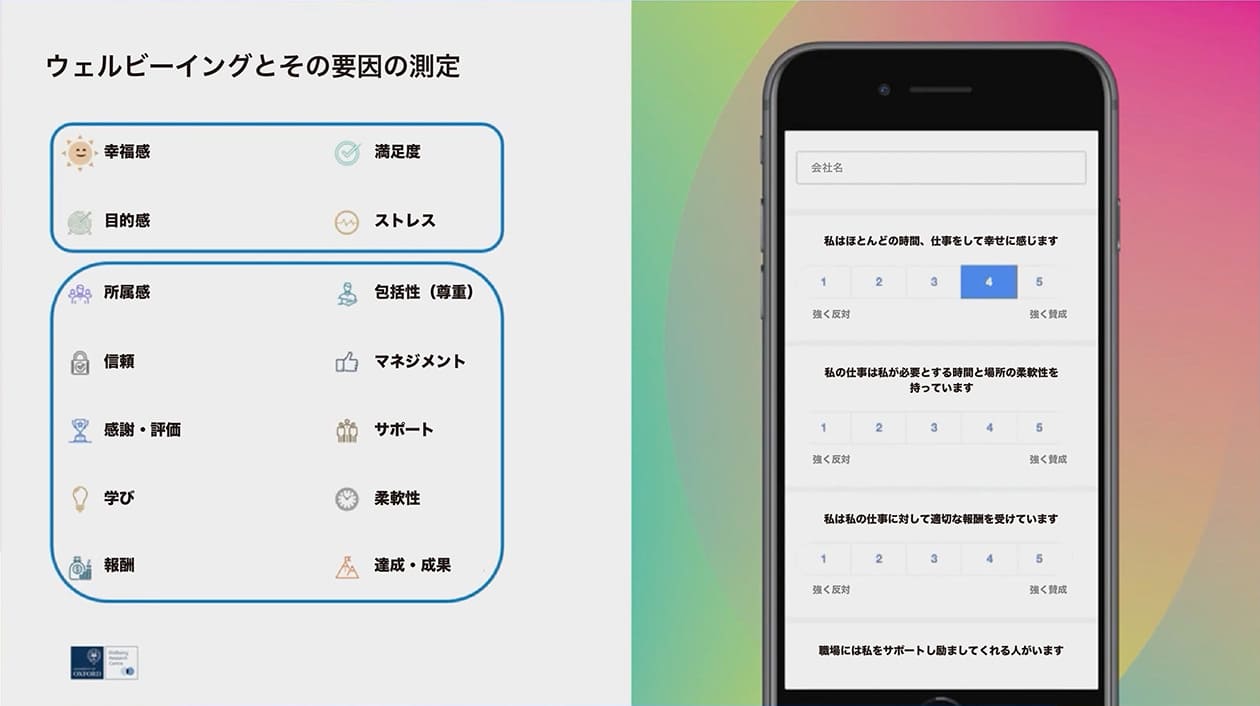
これにより、どのような内容か一部がわかります。ウェルビーイングの結果だけでなく、さまざまな要因についても質問しており、後で詳しく説明します。
・企業間のウェルビーイング比較
概要的な説明をすると、企業間、業界間、職種間、地域間で従業員のウェルビーイングには多くのバリエーションがあります。画面にいくつか例を示しました。Indeedのおかげで行うことができた職場のウェルビーイング世界最大の研究であり、ほぼすべての主要な企業を同じ方法で比較できるのは初めてのことです。これまで、そのようなことはできませんでした。
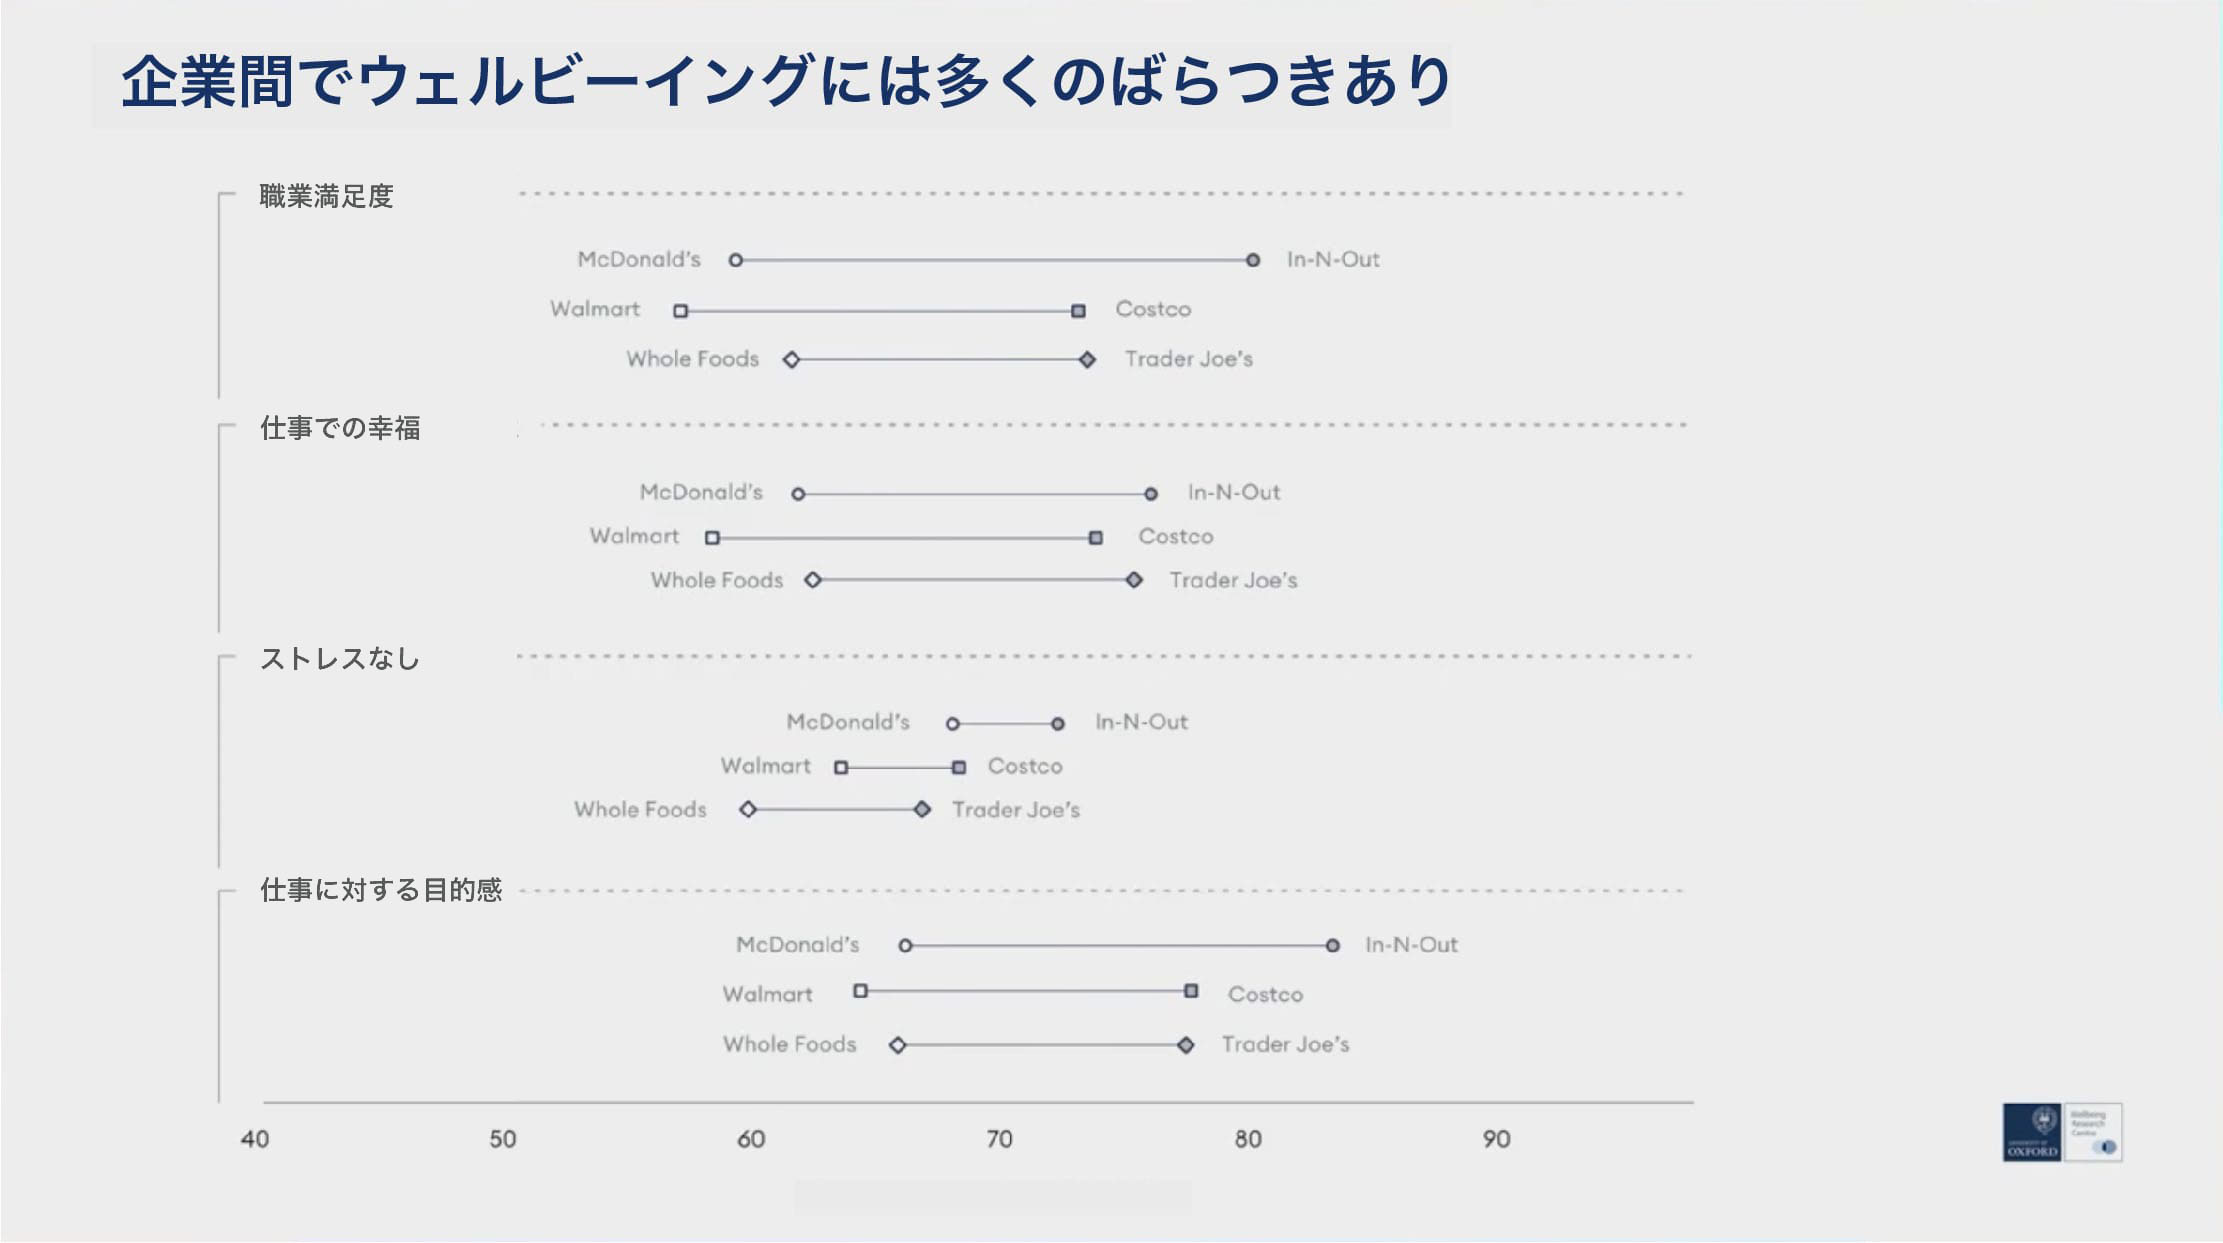
たとえば、非常に標準化された業界であるファストフードのハンバーガーチェーン、バーガーショップを取り上げてみましょう。作業場所が非常に標準化されているにも関わらず、人々が仕事をどのように体験しどのように感じるか、そして仕事満足度、職場の幸福度、仕事への目的感、ストレスなどを測定しても差異が一貫して現れることがわかります。
たとえば、マクドナルドとイン・アンド・アウト・バーガー(米国の南西部や中部で展開するファストフードのチェーンストア)を見てみてください。同じ標準化された作業場所でも、これらの違いが一貫して現れるのです。米国の、特に西海岸に住んでいる方々には非常に馴染みのある事例です。データは豊富で、さらに詳しく掘り下げることができます。
・企業内のウェルビーイング分析
また、企業内部でも分析を行うことができます。大企業では、従業員(現在または過去のもの)から数万件のレビューが寄せられています。以下に示すのはウォルマートの一例で、会社内でも非常に大きなばらつきがあることがわかります。
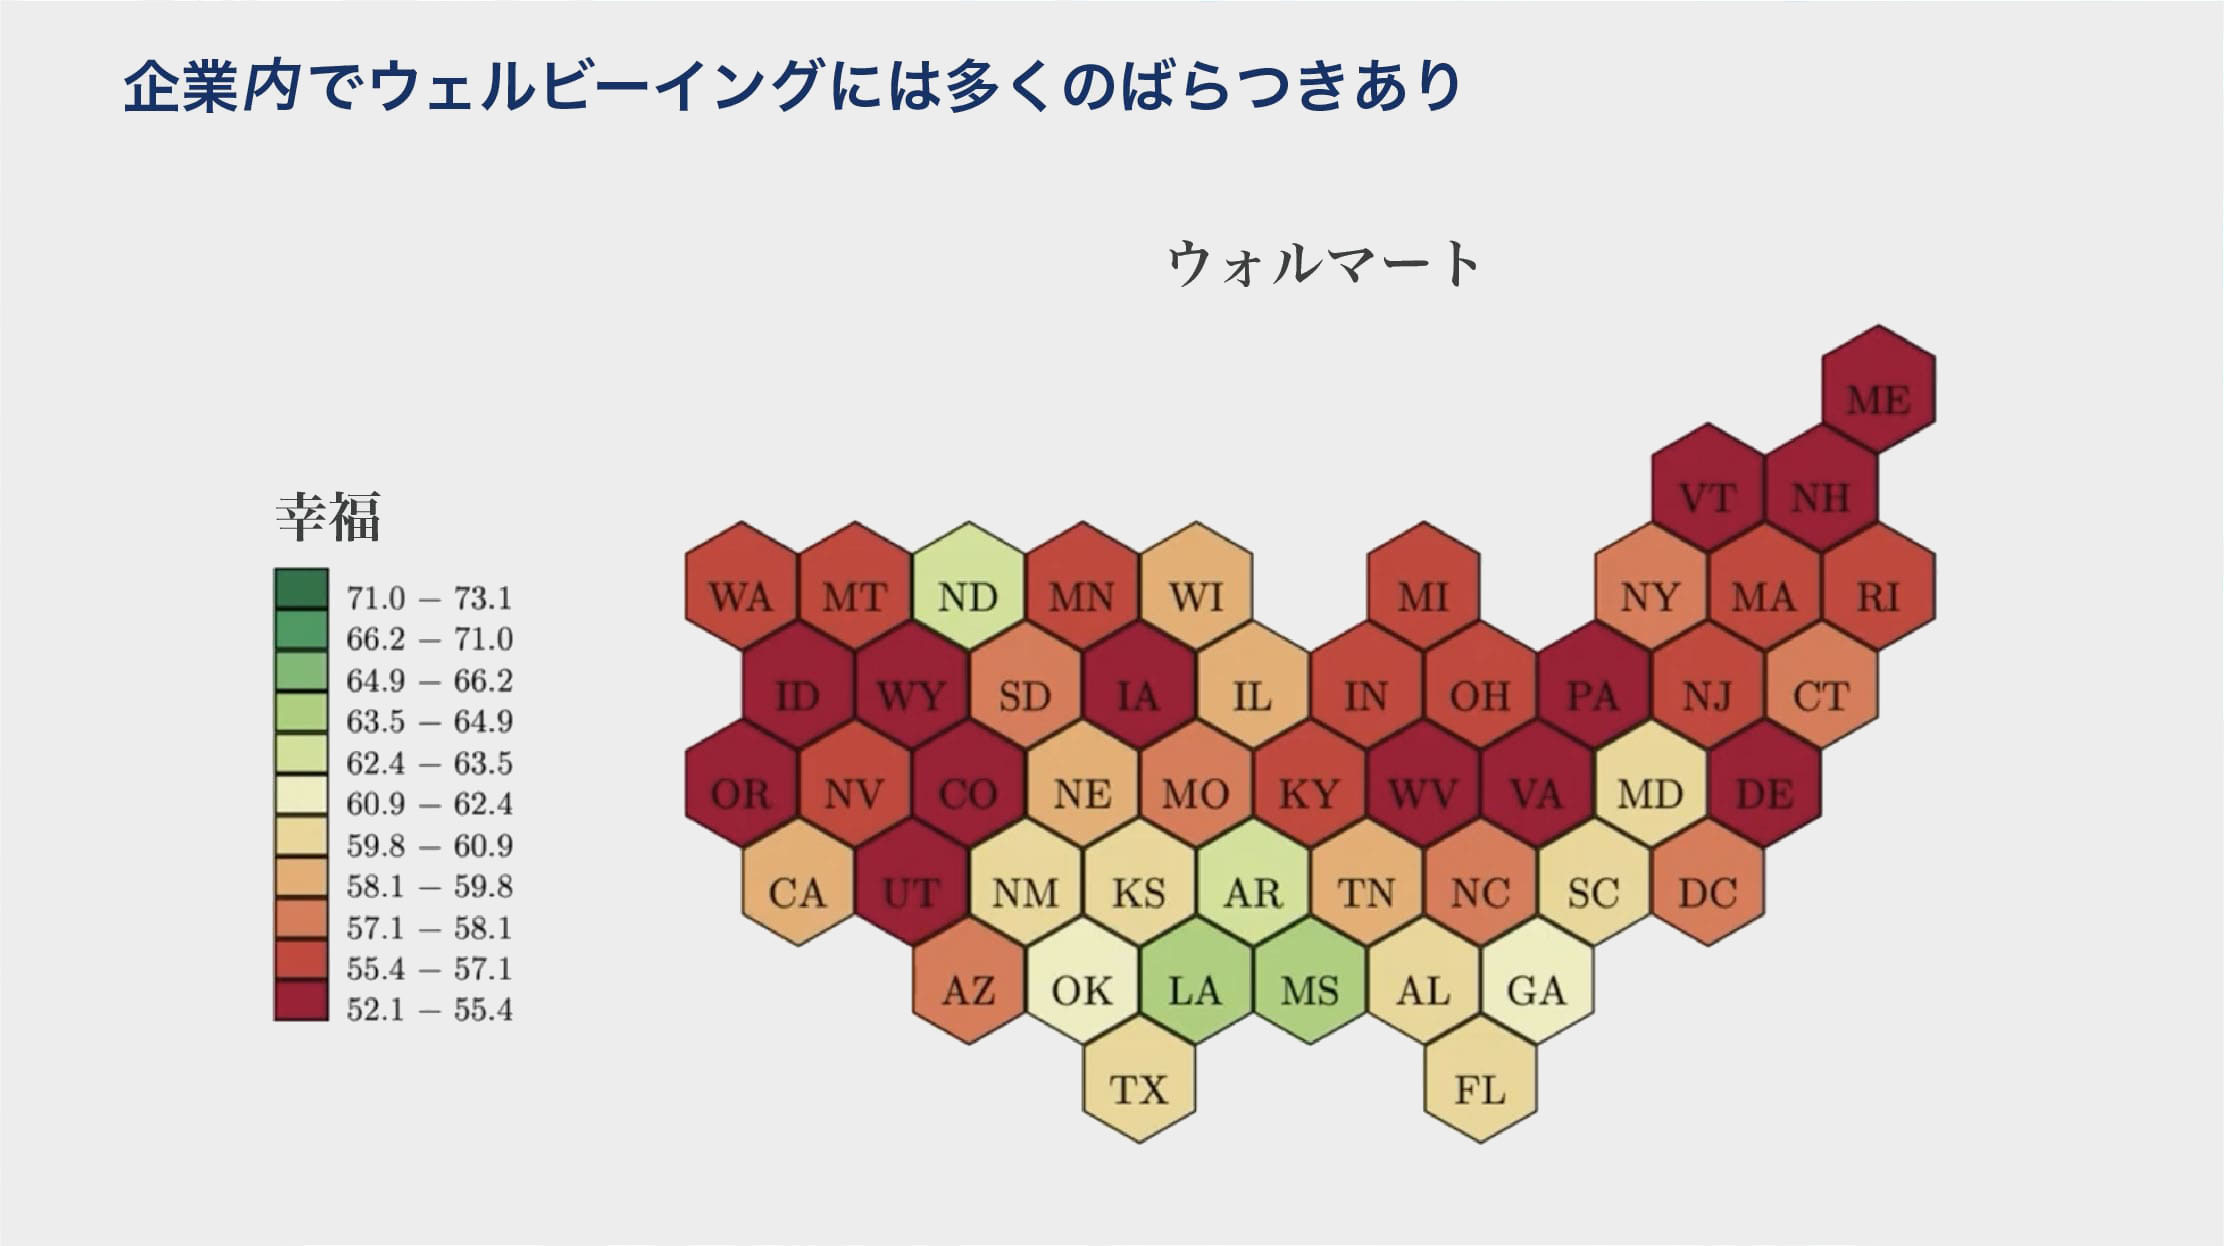
倉庫、店舗、異なる部門での差異が非常に大きいです。そして、これまでのデータから得られた一つの重要な洞察は「職場のウェルビーイング向上は不可能ではない」ということです。なぜなら、データからは困難な地域や困難な状況でも働くことに幸せを感じる素晴らしい職場が見つかるからです。
⚫︎素晴らしい職場を見つけるかどうか。
⚫︎困難な地域や厳しい産業でも働くことに喜びを感じる職場を見つけるかどうか。
⚫︎会社内で最も成績が良くない部署でも、業績を上げ、リーダーシップを示し、優れた職場を作る方法。
ですから、どうか、どうか、どうか、お忘れなく。
それでは、結果について考えてみましょう。ここで少し一時停止して、考える時間も取っていただきたいと思います。
3. 職場のウェルビーイング向上の要因
従業員のウェルビーイングを向上させる要因を見てみましょう。
⚫︎所属感
⚫︎公平な報酬を受け取る感覚
⚫︎多様性
⚫︎キャリアの進展と達成の可能性
⚫︎包括的な(尊重してもらえる)環境
⚫︎サポート
⚫︎信頼
⚫︎マネジメント
⚫︎仕事の中での学習
これらの項目のうち、どれがあなたやあなたのチームにとって最も重要だと思いますか?
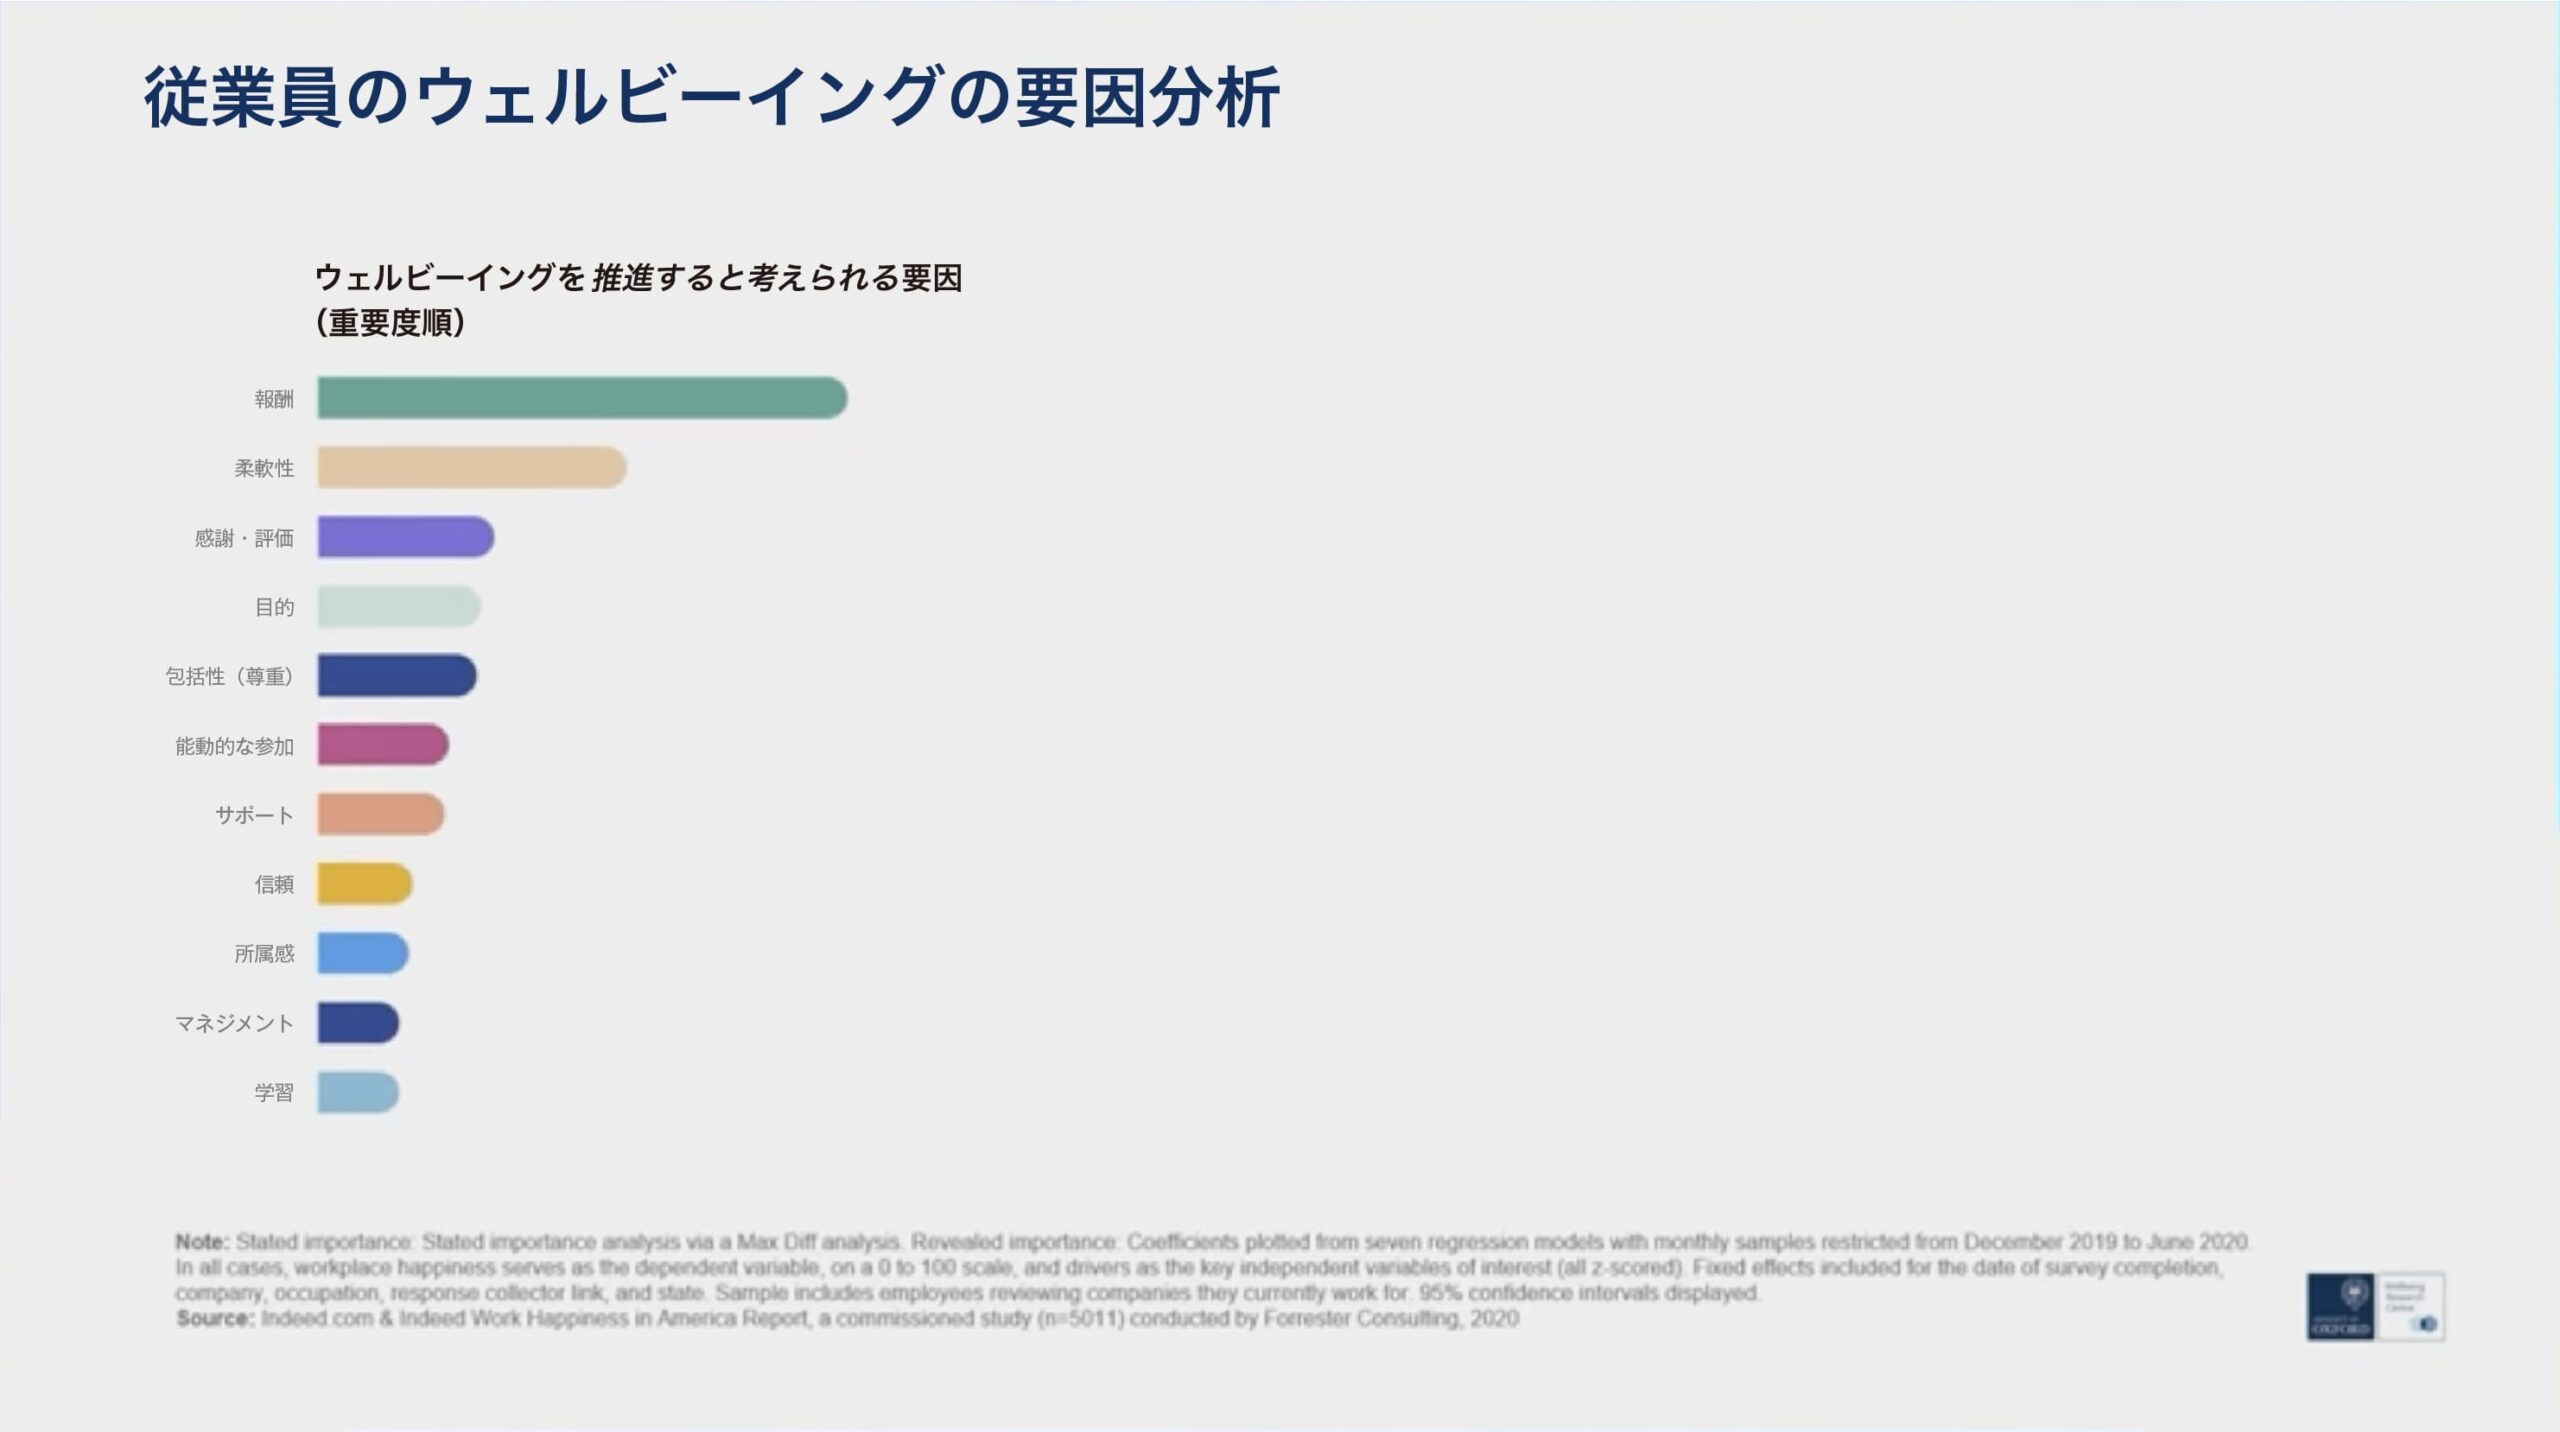
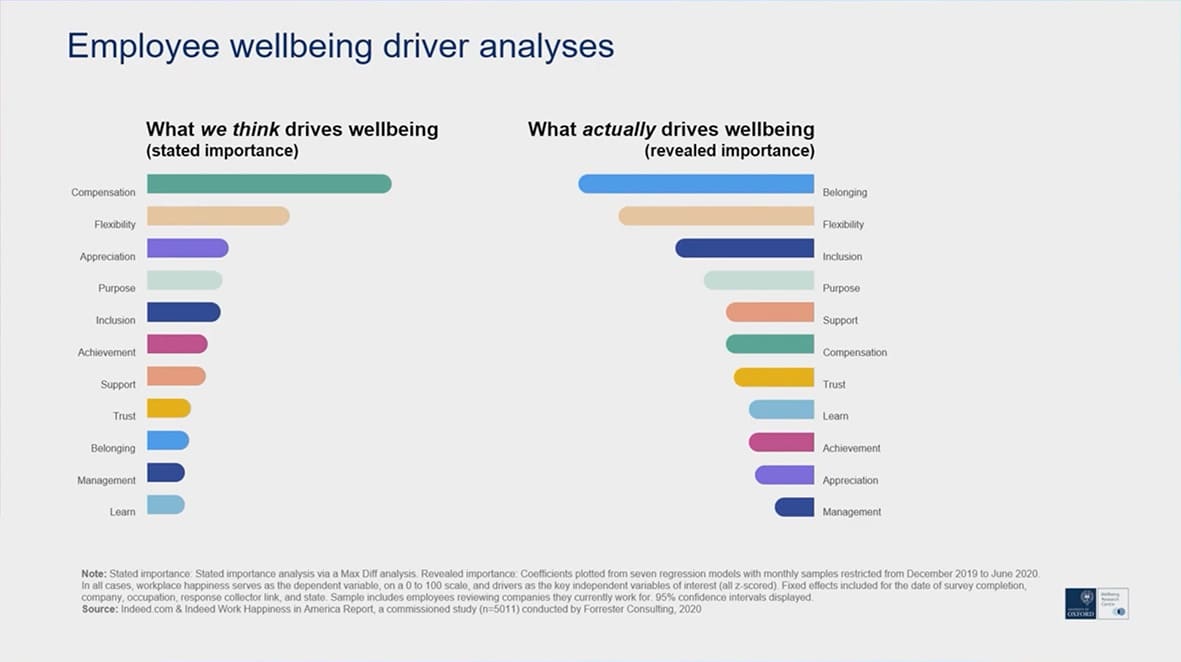
これは今すぐにでも行っていただきたい、簡単な知的エクササイズです。これは、約4,500人のマネージャーや労働者に尋ねたもので、アメリカ全域の回答をもとにしています。彼らの回答によると、彼らが働く際に最も重要だと考える要因の順位が示されており、その結果もっとも重要なのは新古典派的で伝統的な経済学者を喜ばせるでしょうが「仕事に対する適正な報酬」です。
1. 仕事に対する適正な報酬
2. 柔軟性
3. 感謝・評価
と続き、その他にもいろいろあります。これが、人々が職場のウェルビーイングにとって、もっとも重要だと考えるランク順です。
けれども、実際に分析を実行し、どの要因がどのように感じるか、結果指標と最も強く相関しているか、を見ると適正な報酬を受けることは重要ですが中程度の順位となります。
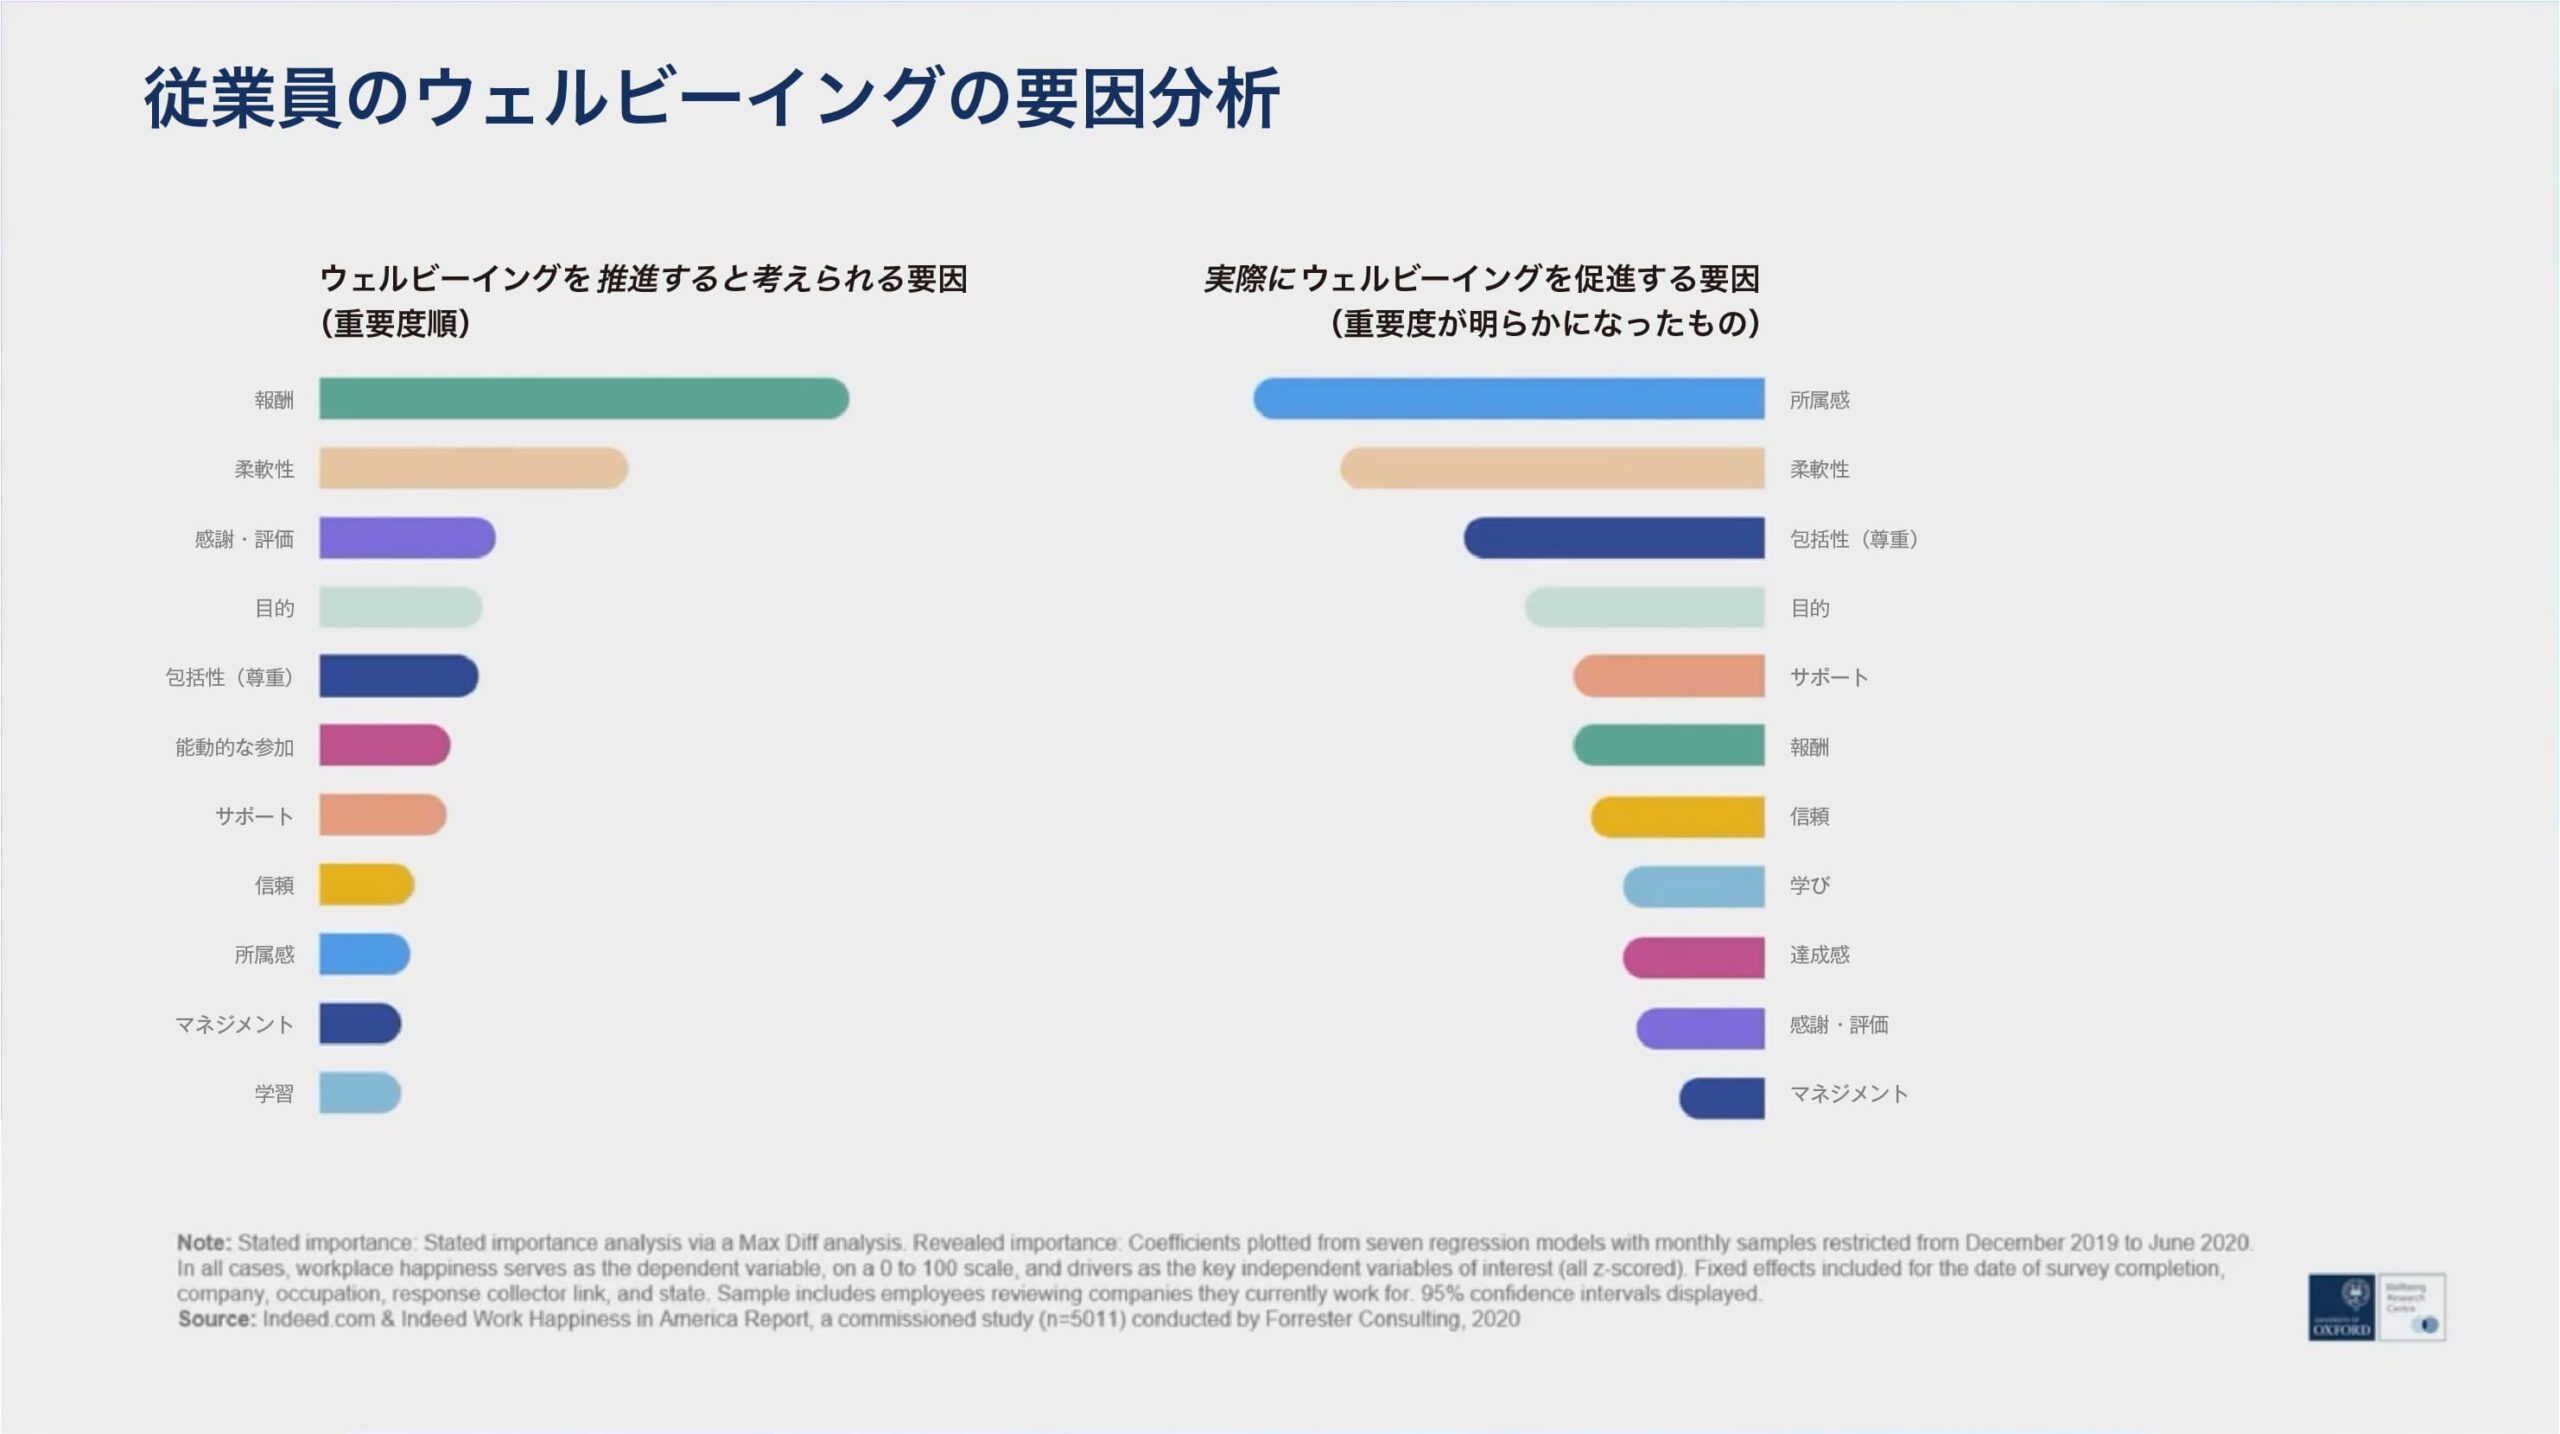
対して、一番上に来るのは所属感です。
1. 所属感
2. 柔軟性
3. 包括感(尊重)
もしあなたが所属感を最上位か最上位近くに置かなかったとしても、あなただけではありません。
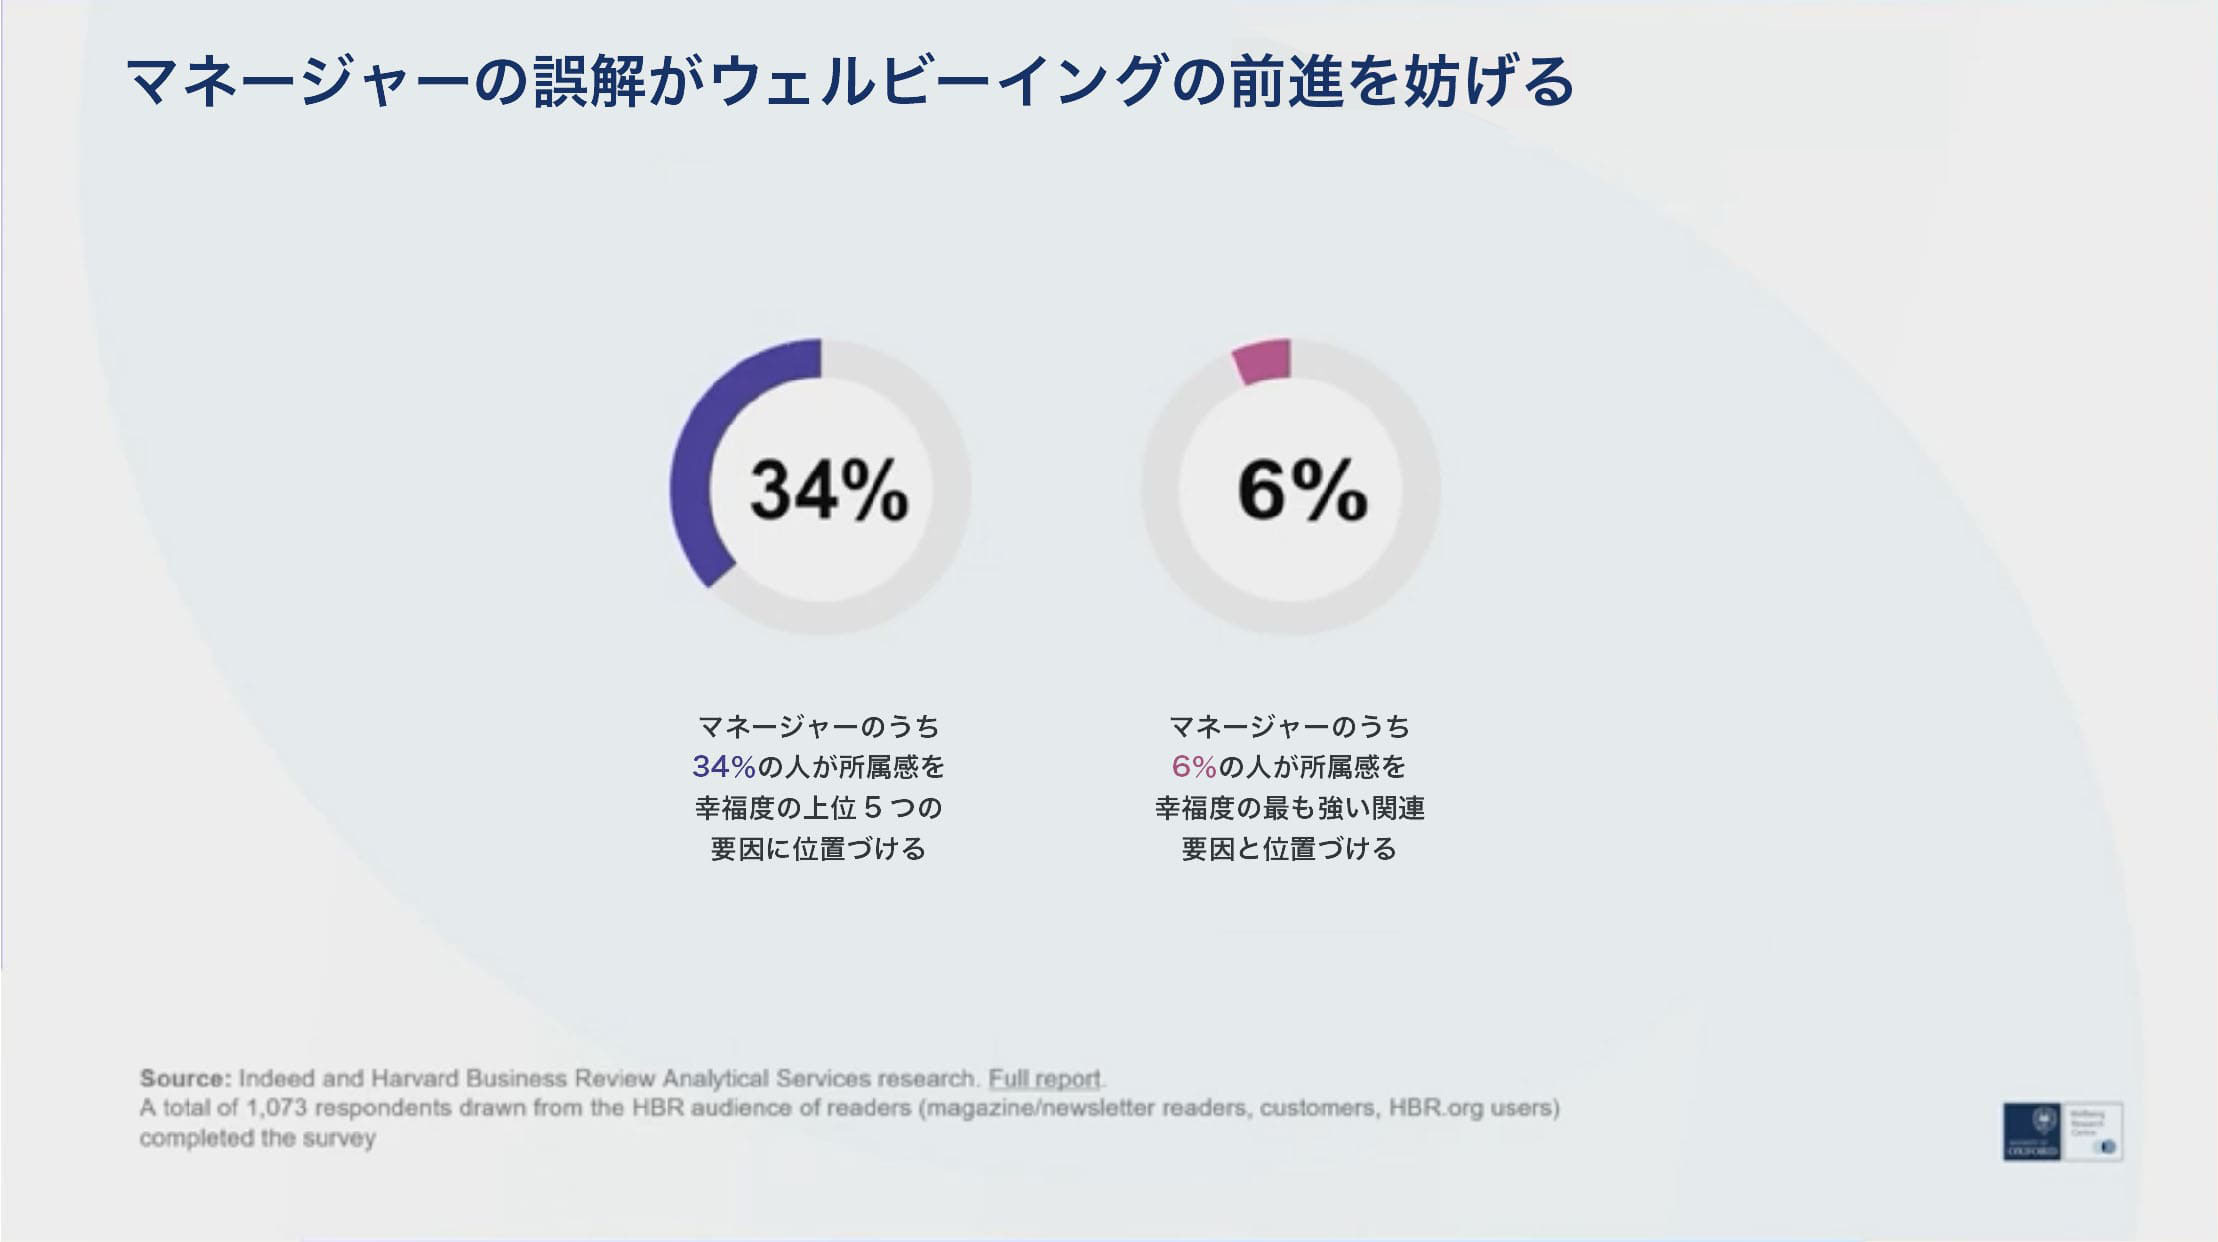
実際、所属感を最も重要視したマネージャーは、わずか6%です。所属感を職場のウェルビーイングと最も強く関連する要因の1つとして上位5位に位置づけたのは、34%に過ぎませんでした。所属感は定義が難しい要因ですが、少し深く掘り下げると以下が定義できるでしょう。
所属感の定義:
⚫︎会社があなたを人間として大切にしている感覚。
⚫︎職場で友達がいる感覚。
⚫︎自分の仕事が組織内の他者にどのような影響を与えるか知っている感覚。
つまり、所属感はあなたの社会的資本、社会的つながり、そして所属感自体を指します。
4. ウェルビーイングは生産性、採用、人材定着にどのような影響を与えるか
さて、次にウェルビーイングが、生産性や採用、人材定着にどのような影響を与えるかを見ていきましょう。
まず、私たちが最も時間をかけた研究を紹介します。正確に言うと、非常に長い年月を要しました。約7年です。さらに、別のパートナーが必要でした。今回の場合、イギリスではBritish Telecom(BT)として知られる最大の私企業の雇用主です。私たちは彼らのコールセンター全従業員を対象に調査しました。そして、木曜の午後に「今週どれくらい幸せですか?」と尋ねました。
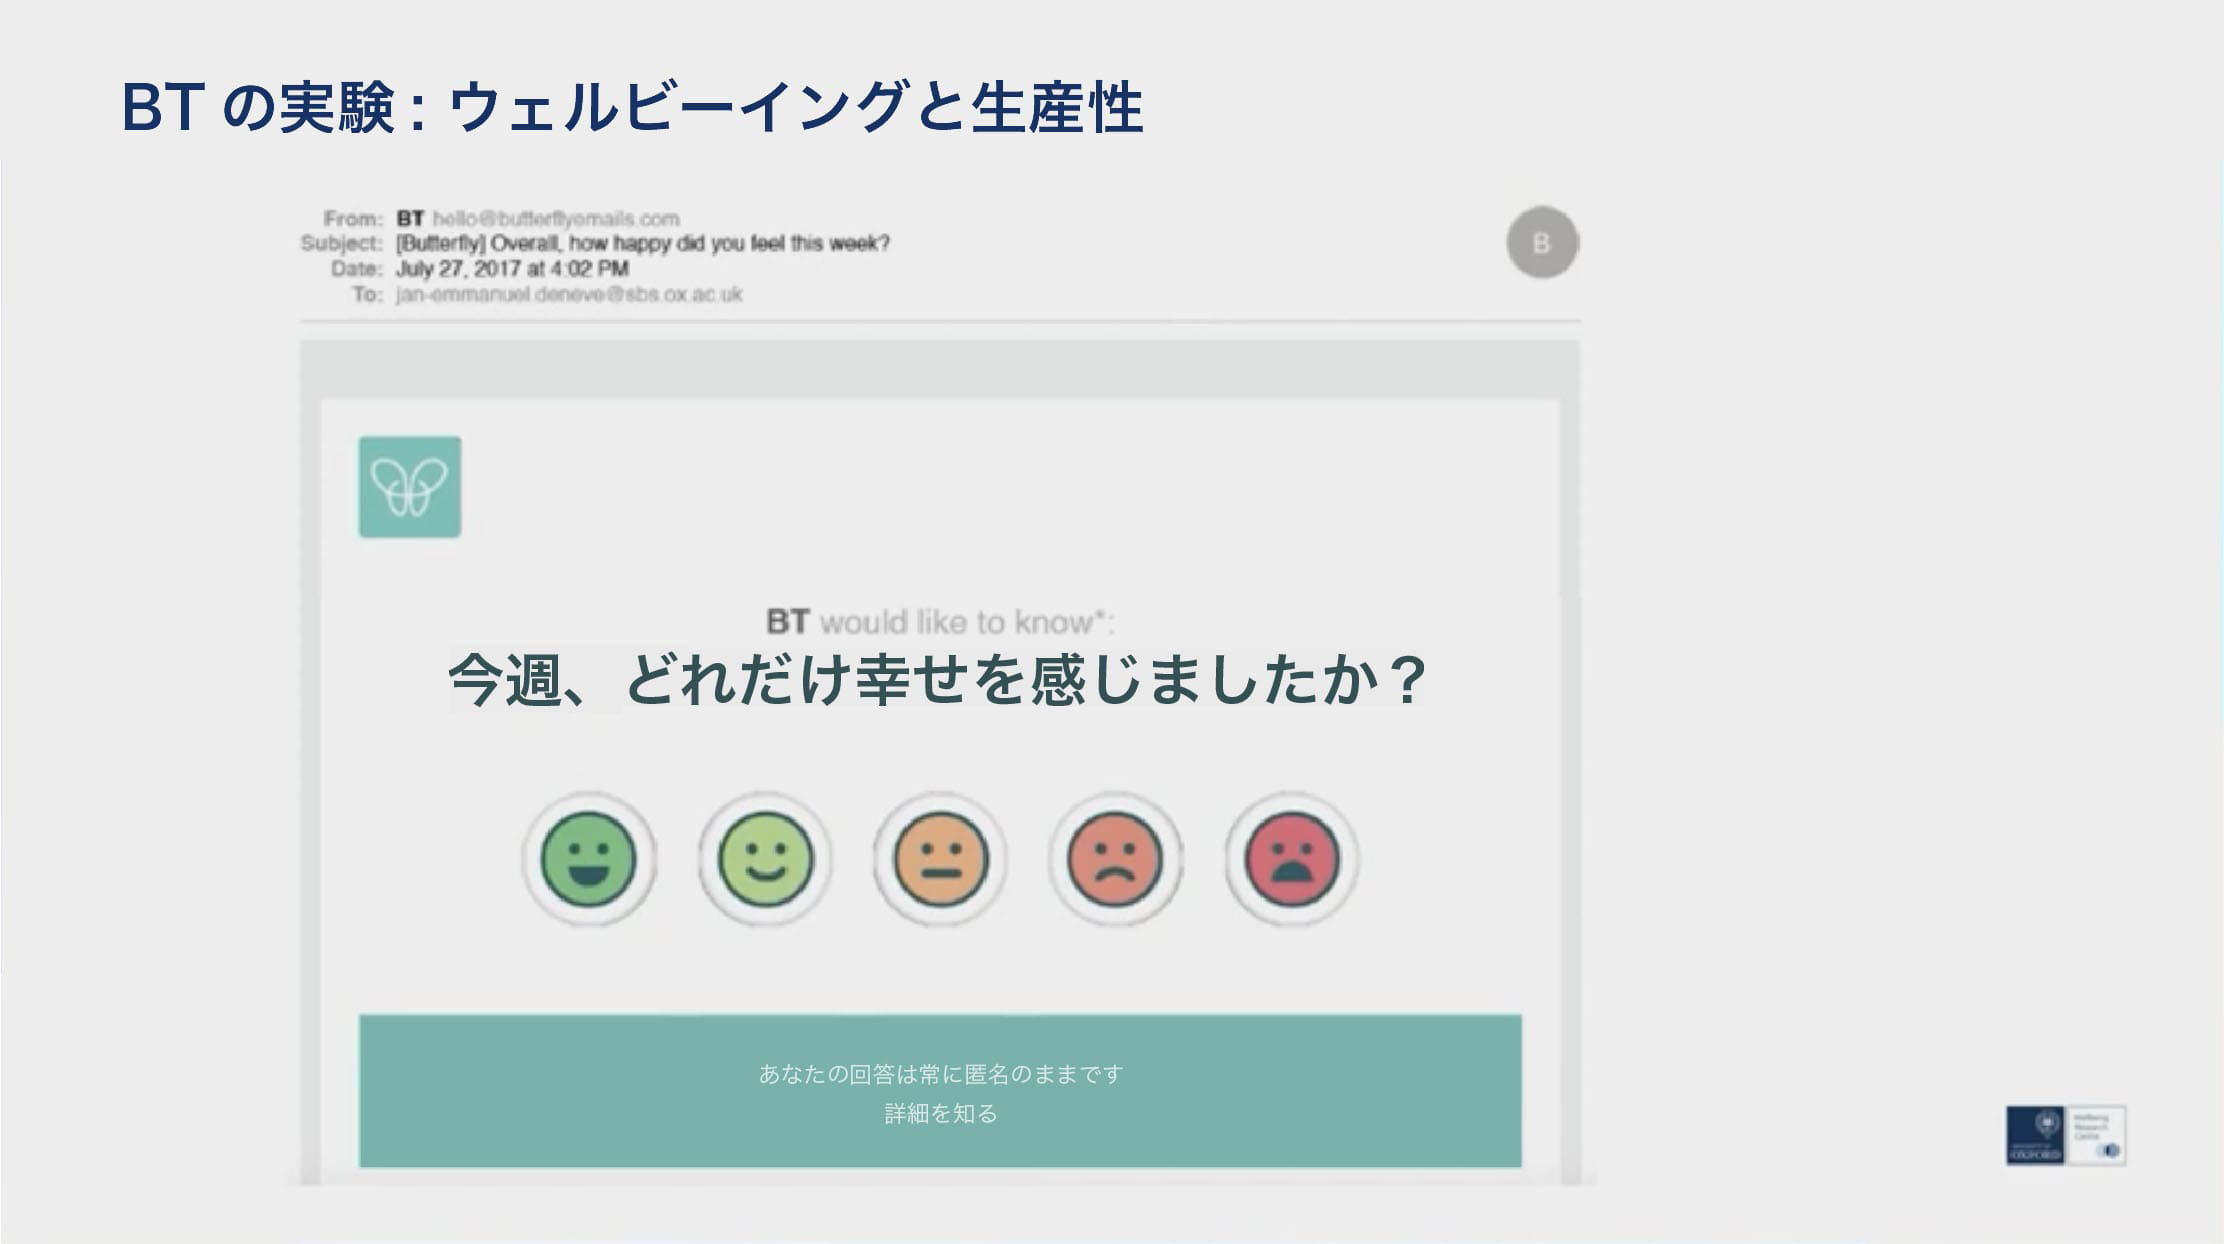
彼らは1から5までのスマイリーで回答し、日を追うごとに回答者の数は少し減っていきました。
これが大規模なプロジェクトの始まりでしたが、個人としてどのように感じ、どれだけ生産的であるかの因果関係を初めて明らかにしたと考えています。なぜなら、我々はその後、これらの従業員のウェルビーイング・データを週ごとに非常に詳細なパフォーマンスデータと照らし合わせたからです。
©Getty Images
まず、私たちが受け取った結果について一般的な感触をお伝えしましょう。
これらはイギリス全土に広がる約20のコールセンターです。横軸にはそれらのコールセンターで報告された平均週間の従業員のウェルビーイング、縦軸には週ごとの平均顧客満足度が表示されています。これによって、従業員の職場での感じ方と、顧客が感じる仕事の質との相関関係が非常に強いことが最初に分かります。
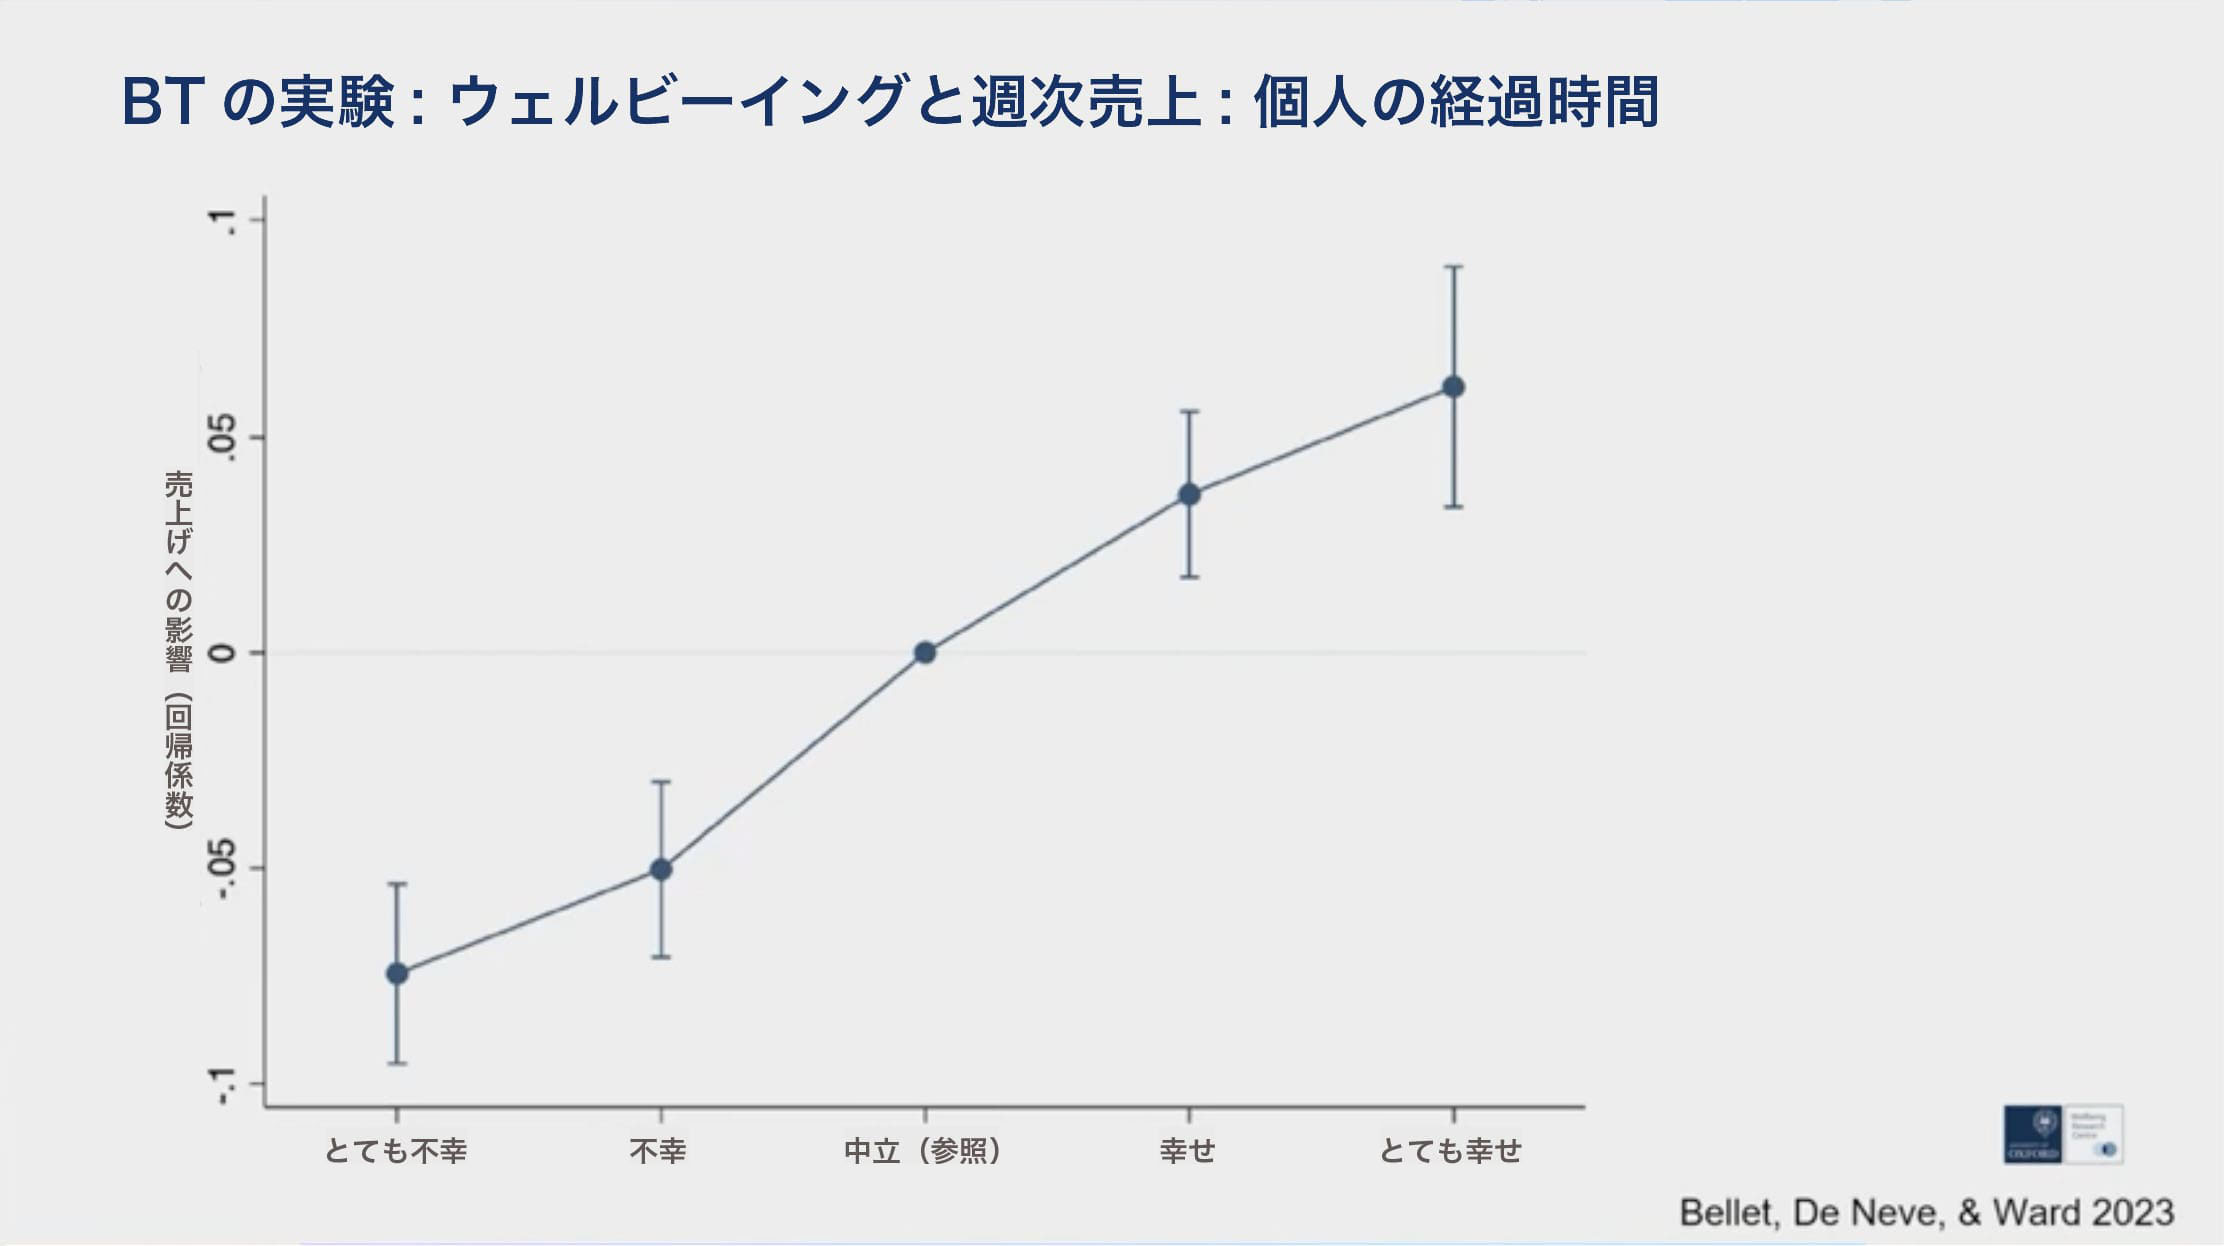
けれども、本当に私たちが深く掘り下げ多くの時間を費やしたのは、個人的なリンクを見ることです。これが、コールセンターの興味深い点です。個々のウェルビーイングを測定し、個々のパフォーマンスに結びつけることができます。そして、この研究の主な結果は、0-10のスケールで1ポイントの変化に対し週ごとの売上が12%増加したことです。私たちには他にも多くのパフォーマンス指標がありますが、これがメディアで取り上げられた主な結果です。
・ウェルビーイングとパフォーマンスの因果関係
なぜ週ごとの感じ方が週ごとのパフォーマンスに対して強い因果関係があるのでしょうか?
それは、長時間労働やより多くの努力をするからではなく、単純に彼らがより良く働いていたからです。社会的・感情的知性を高めていたか、それらが活性化されていたかを見つけ、それが通話での(顧客満足の)変換率を上げるために翻訳されたことを見つけました。
極端な例を挙げると、不満な顧客が電話してきた場合、その週に気分が良かった人々は、そうでなかった場合よりも、その顧客を保持できる可能性がはるかに高かったです。だからこそ、
・どのような経路を通じて
・なぜそのような影響があるのか
見つけることは非常に強力でした。
BTの研究については、もっと話せますが、次に進みましょう。第二の経路について話します。それは、全体的なパフォーマンスへの影響であり、採用を通じてです。良い職場は、優れた人材を引き寄せることにも優れています。これは、ほとんどのビジネスリーダーにとって非常に重要な問題です。
・良い職場は優れた人材を引き寄せるか
ここで、私の同僚ジョージ・ウォードの素晴らしい研究に触れる必要があります。これは今ではオンラインで公開されており、MITのワーキングペーパーとして発表され、まもなくトップの査読付きジャーナルに掲載されることを期待しています。彼は良い職場が優れた人材を引き寄せる、初めての因果関係あるエビデンスを提供することができました。
彼は、仕事の検索広告に「職場に関する情報」を表示することで、この効果を示しました。2,400万人の求職者に対し、ランダムに良い職場を表示するかどうかに分け、良い職場が良い人々を引き寄せる影響があることがわかりました。Indeedの信じられないほどのデータ収集の取り組みのおかげです。

ですから、それが良い職場であるかどうかによって人々は求職行動を変え始めています。それが口コミを通じて、またはIndeedやGlassdoorなどの素晴らしいクラウドソーシングの取り組みを通じてであっても、人々は行動を変え始めています。
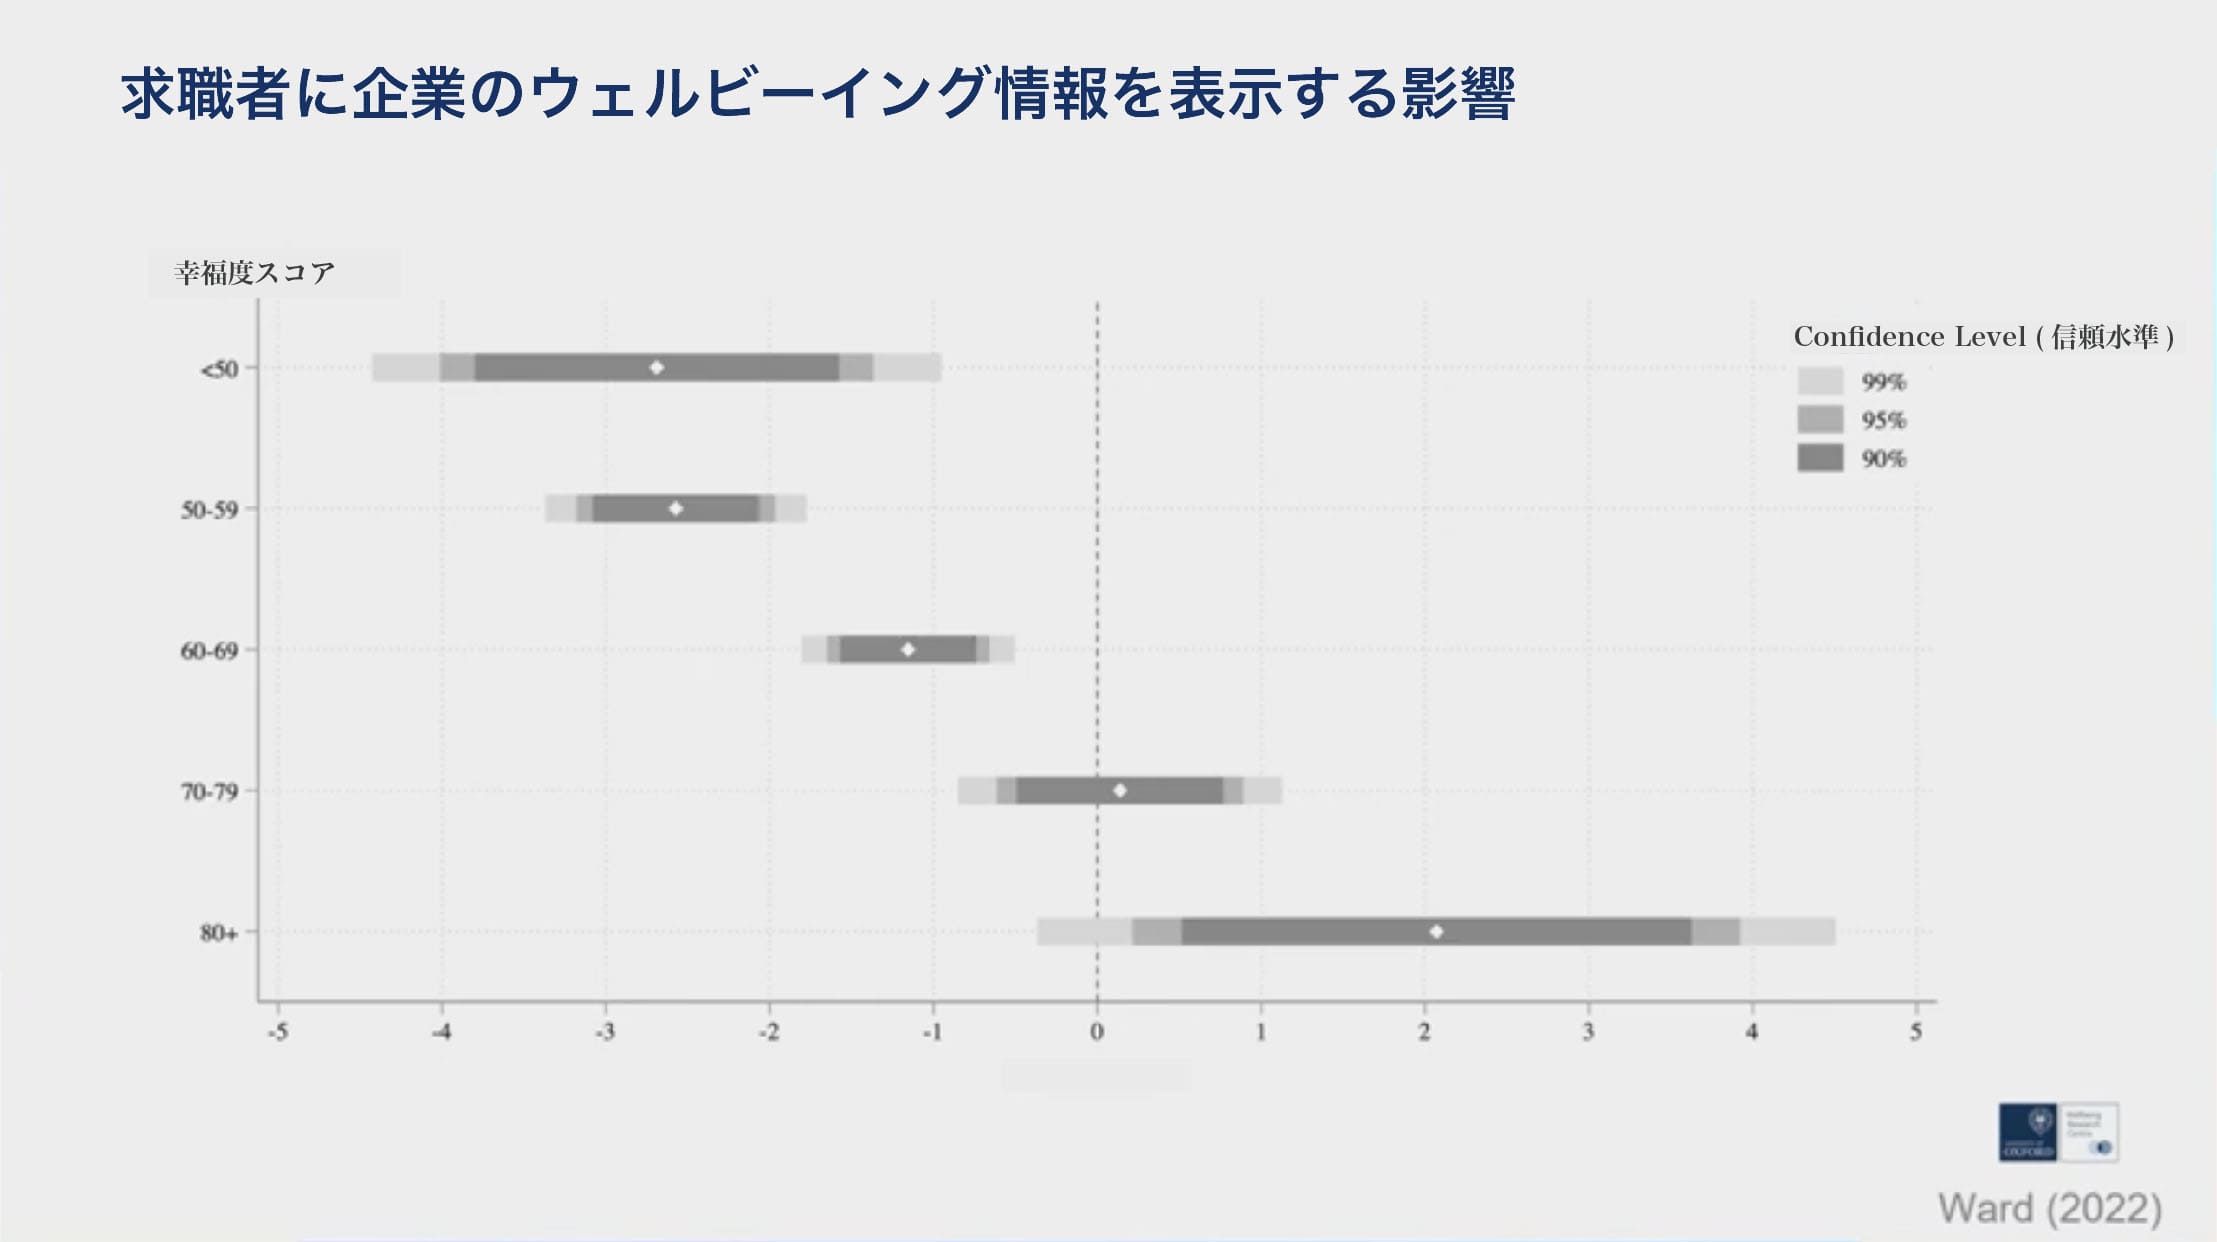
それは、良い職場かどうかに応じて人々が行動を変えるかどうか、にかかっています。グッドプレイスで働く、ということです。
・従業員のウェルビーイングと企業パフォーマンス
さて。従業員のウェルビーイングが企業パフォーマンスに影響を与える第三の経路は、定着を通じてです。
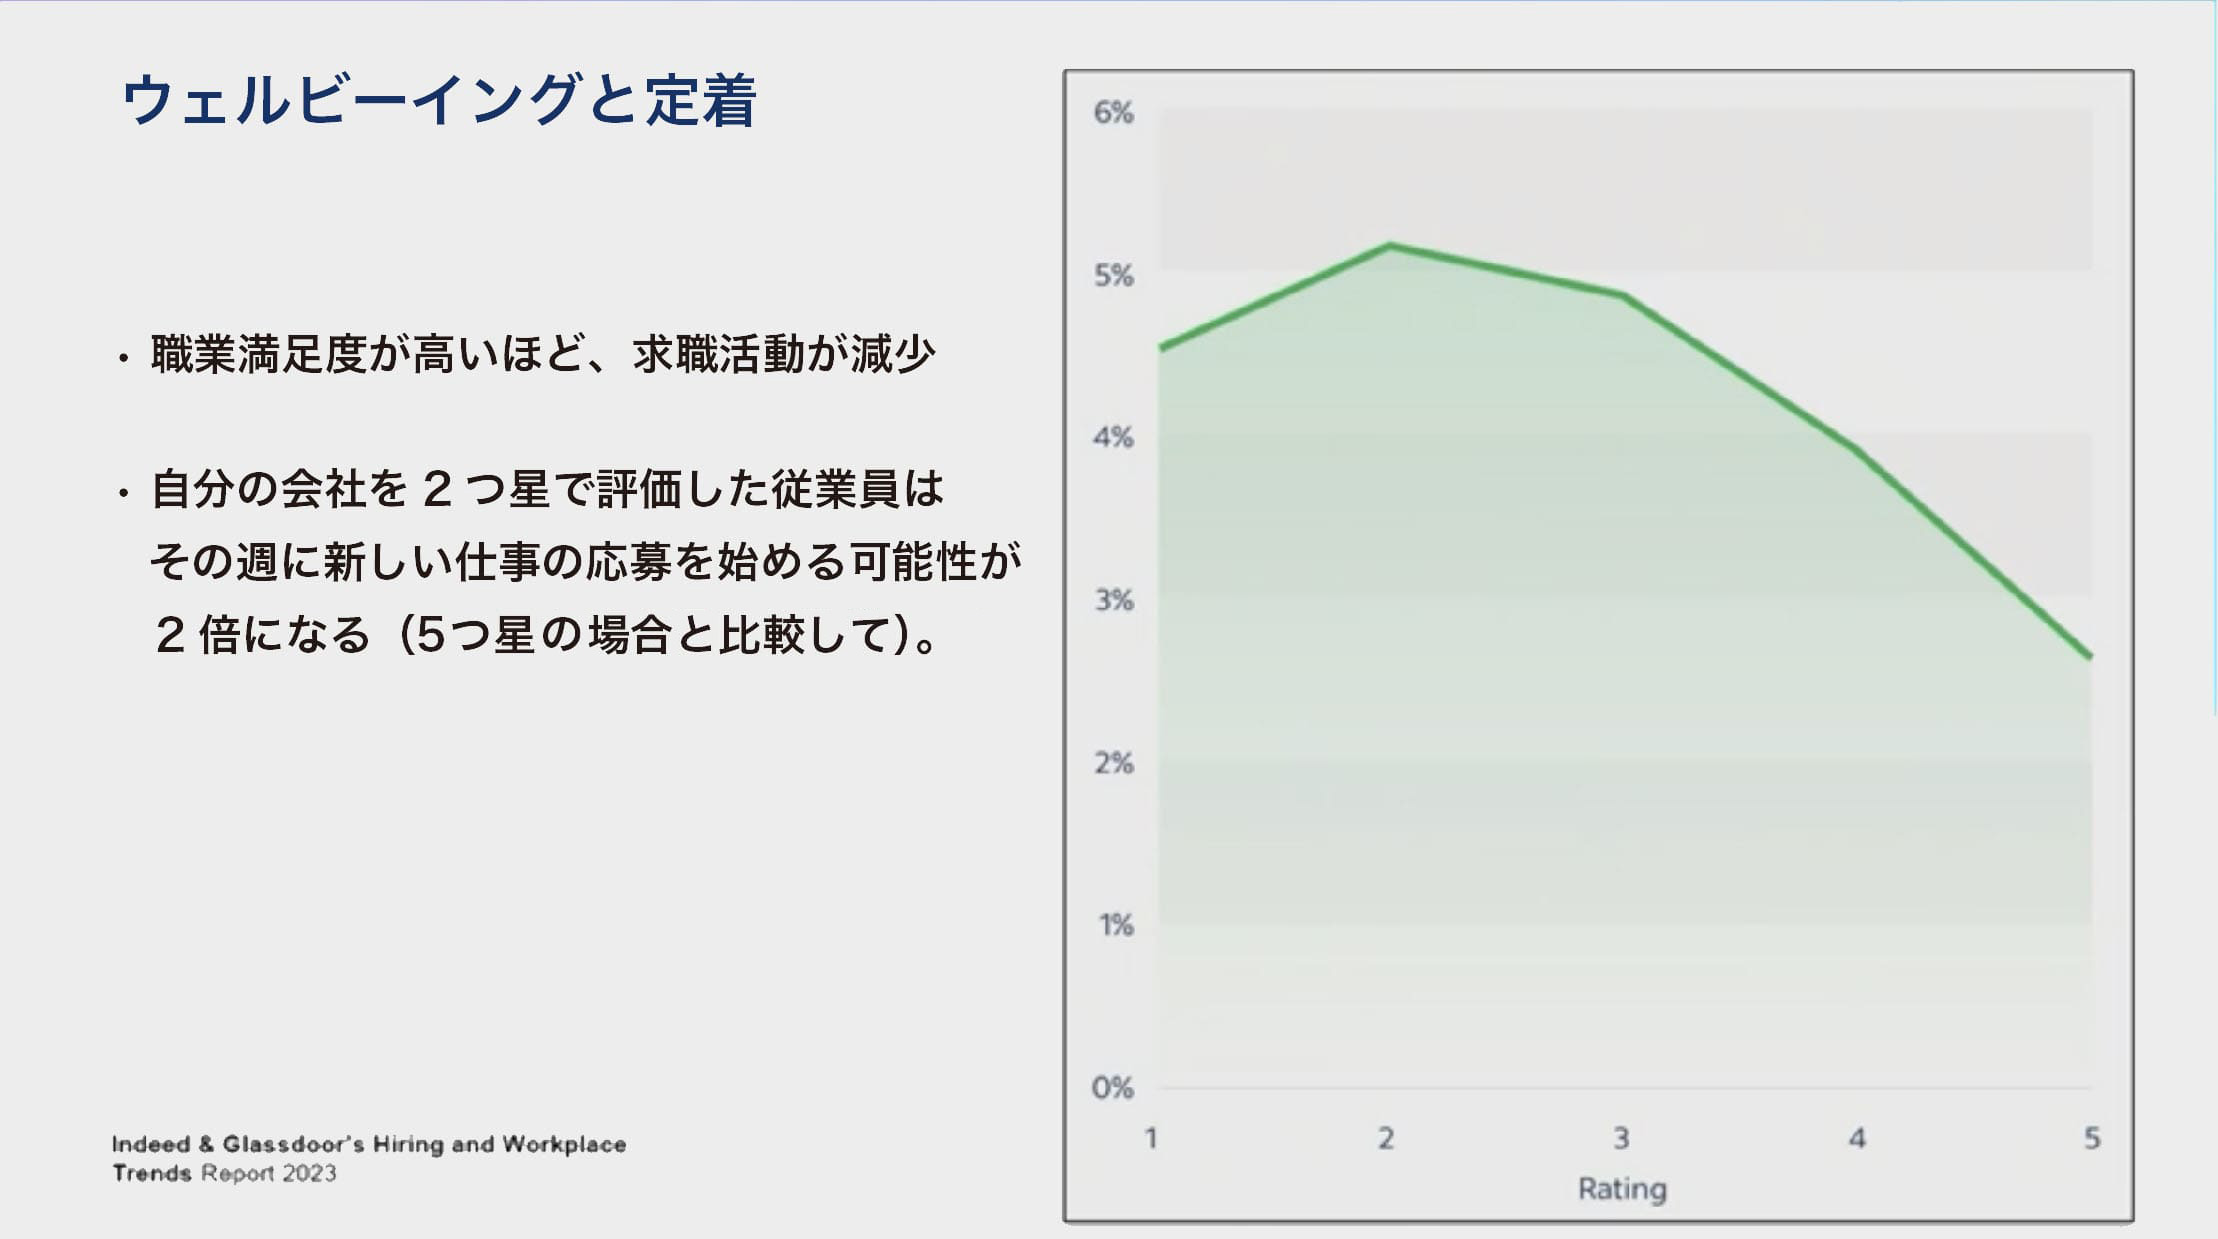
これは別の企業、Glassdoorのデータです。関連性を示すための方法はいくつかありますが、かなり興味深く同じようなことを示します。
従業員が他の求人に応募するかどうかは、現在の職場に対する高い評価や低い評価に依存、あるいはその機能によって測定できます。要するに、従業員は自身が付けた評価が低い場合、一週間の間に他の求人を探し出し、実際に応募する可能性が2倍になります。つまり、5段階評価のうち2段階評価だと、同じ週に別の仕事へ応募する可能性が2倍になります。したがって、このような経路が存在することを示唆する累積的な証拠が非常に多く存在します。
過去7年、8年、9年にわたり、私たちは多くの研究プロジェクトに取り組んできました。これらのプロジェクトは共に、職場のウェルビーイングに関する非常に実証的で強力なイメージを形成し始めています。
5. ウェルビーイング測定とビジネス面の影響
どのようにウェルビーイングを測定するのでしょうか?何がそれを駆動させるのでしょうか?これらの要因の相対的な重要性はどうでしょうか?そして、時間の経過と共にこれらの要因はどのように変化するでしょうか(COVID-19前、COVID-19中、COVID-19後)?
他方、アウトプットは、ビジネス面にどのような影響を与えるでしょうか?生産性を向上させるでしょうか?人材の引き寄せに役立つでしょうか?人材を維持するのに役立つでしょうか?また、投資の機会に対する資本コストに、どのような影響を与えるでしょうか?
この分野に関しては、まだまだ進展があります。私たちは、これらを一つの包括的なモデルにまとめるため、一生懸命に取り組んでいます。それが、皆さんにとって非常に有用であることを願っています。
まだお伝えしていないことが、もう一つあります。これらの四経路、つまり企業パフォーマンスに影響を与える四経路が組織レベルでどのように影響を及ぼしスケールするか、ということです。
なぜなら、人々が「幸せな労働者は生産的労働者だ」と言うとき、確かにそうですが、職場をより幸福な職場にするためには一定の投資が必要です。そして、これらの経路がすべて連動して企業にネット上のプラス結果をもたらすかどうかを確認するためには、それらをすべて統合し企業レベルで従業員のウェルビーイングと株式市場のパフォーマンスとの間で分析を行うしかありません。
世界最大の研究は、ついにそれを行うことができるようになりました。したがって、従業員のウェルビーイングへの投資の適切なビジネスケースが、初めて正式に作成されたと言えるでしょう。私はその結果のいくつかを皆さんと共有することを非常に楽しみにしています。
・ウェルビーイングと財務パフォーマンスの相関関係
最初の結果は、財務パフォーマンスに関するものです。
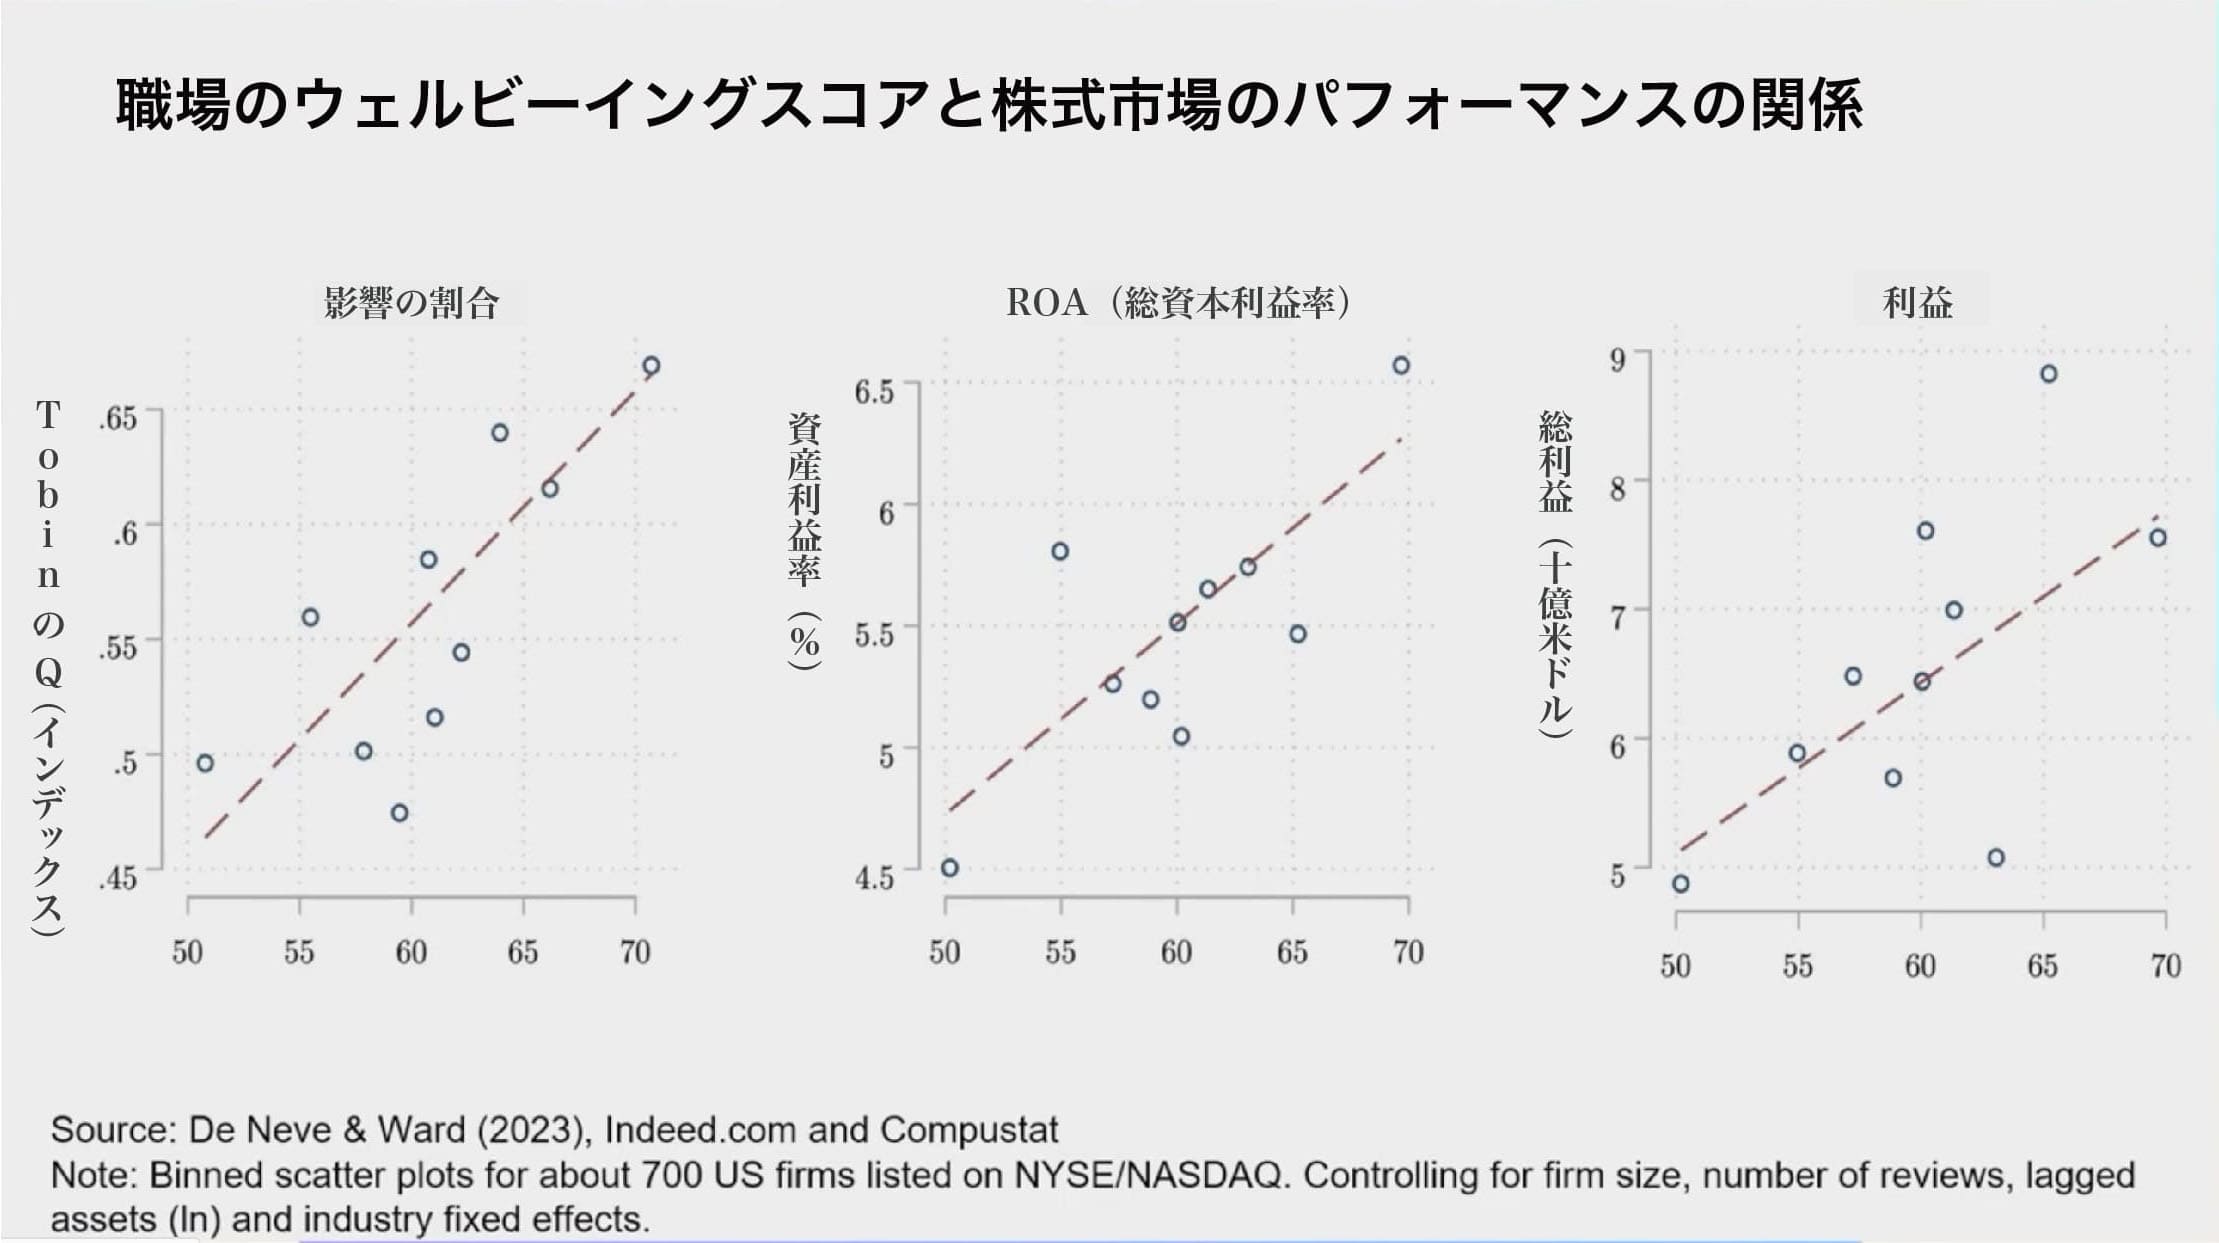
表示されているのは、米国の株式上場企業です。約700社のデータがあり、それらの企業での人々の感情を伝えるためにIndeedを通じて集められたデータがあります。当然、株式上場企業は四半期毎に非常に標準化された体系的な方法で、すべての財務パフォーマンス指標を報告する必要があります。それが私たちが使用するデータです。企業での人々のウェルビーイングを、同じ四半期に報告されたデータと照合しています。表示されているものは、企業での「人々の感情と企業価値」、「資産利益率」、および「総利益性」との非常に強力な相関関係です。
これは相関の関係です。私たちはこれらのデータをさらに詳しく調査し、その予測力も確認しています。ただし、次に紹介することは、特に株式市場のパフォーマンスの予測力を感じることができる内容です。表示されているのは単に、標準的な米国の指数です。
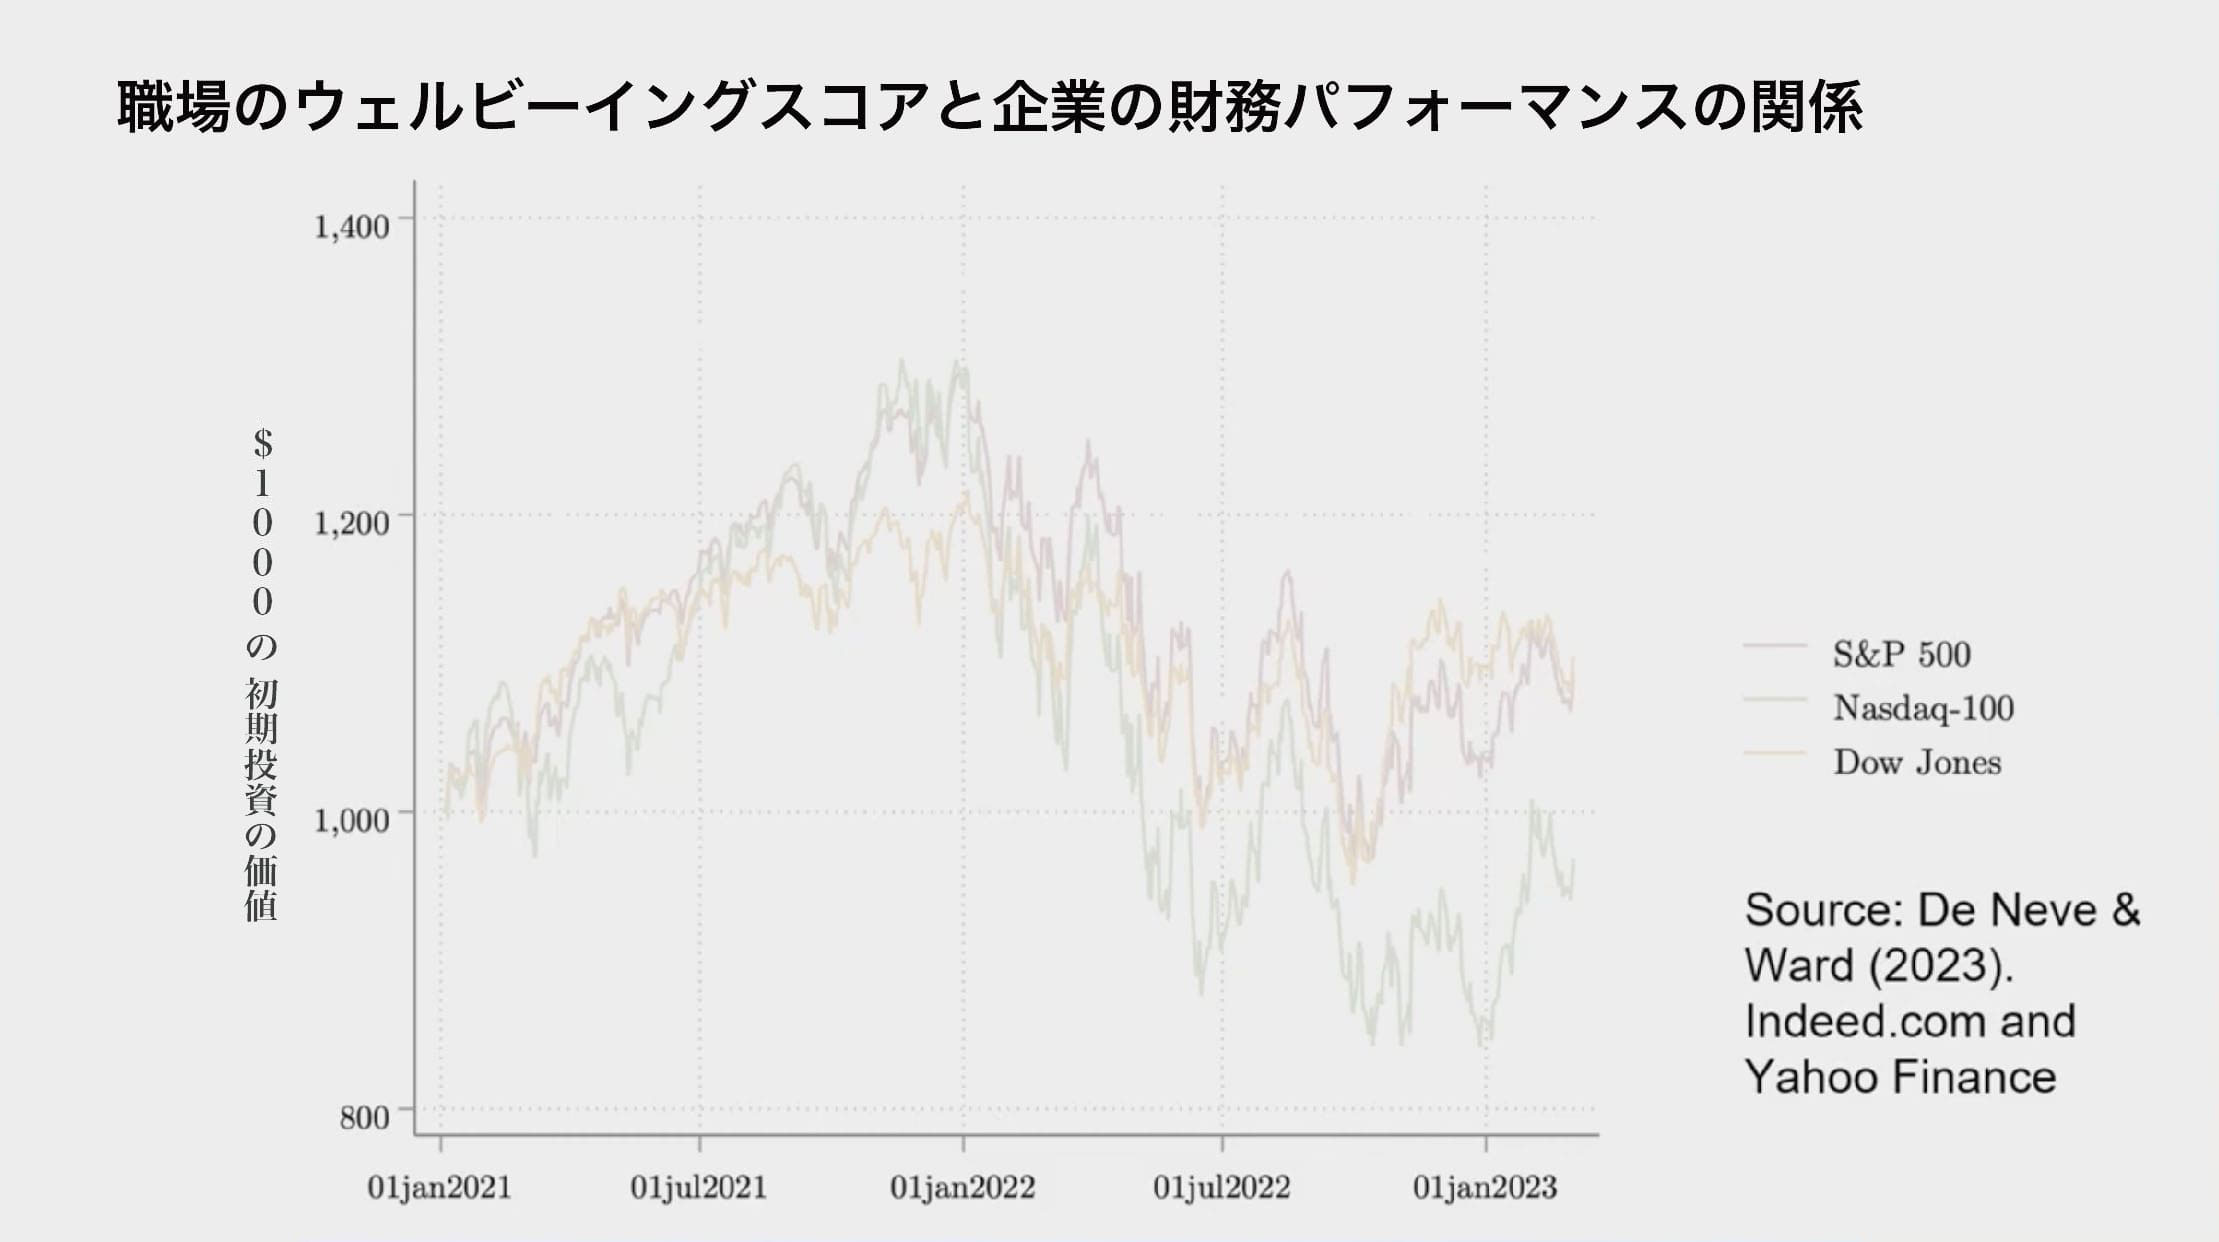
S&P 500、ナスダック 100、そしてダウ・ジョーンズです。2021年のブルラン(Bull Run: 株式市場で一定期間にわたり株価が急騰する状態)では上昇し、2022年には皆さんも痛感した通り大きく下落し、今年の1月から3月にかけて非常に不安定だったことが分かっています。
さて、もしも世界でもっとも優れた職場の企業のポートフォリオ(企業の活動や取り組み、資源の配分、戦略)に投資できるとしたら、少なくともアメリカの文脈では「最高の職場」の企業に投資することができたとしましょう。大規模なクラウドソースのデータセットにより、これらの企業を比較することができ、特に株式市場で利用可能な大企業すべてを比較できます。
そうしたデータセットを用いて、従業員の声を聞くこと、職場での彼らの経験を基に投資を行う、という方法を採用しました。私たちの株式市場のポートフォリオのパフォーマンスは、この方法で得られたものです。
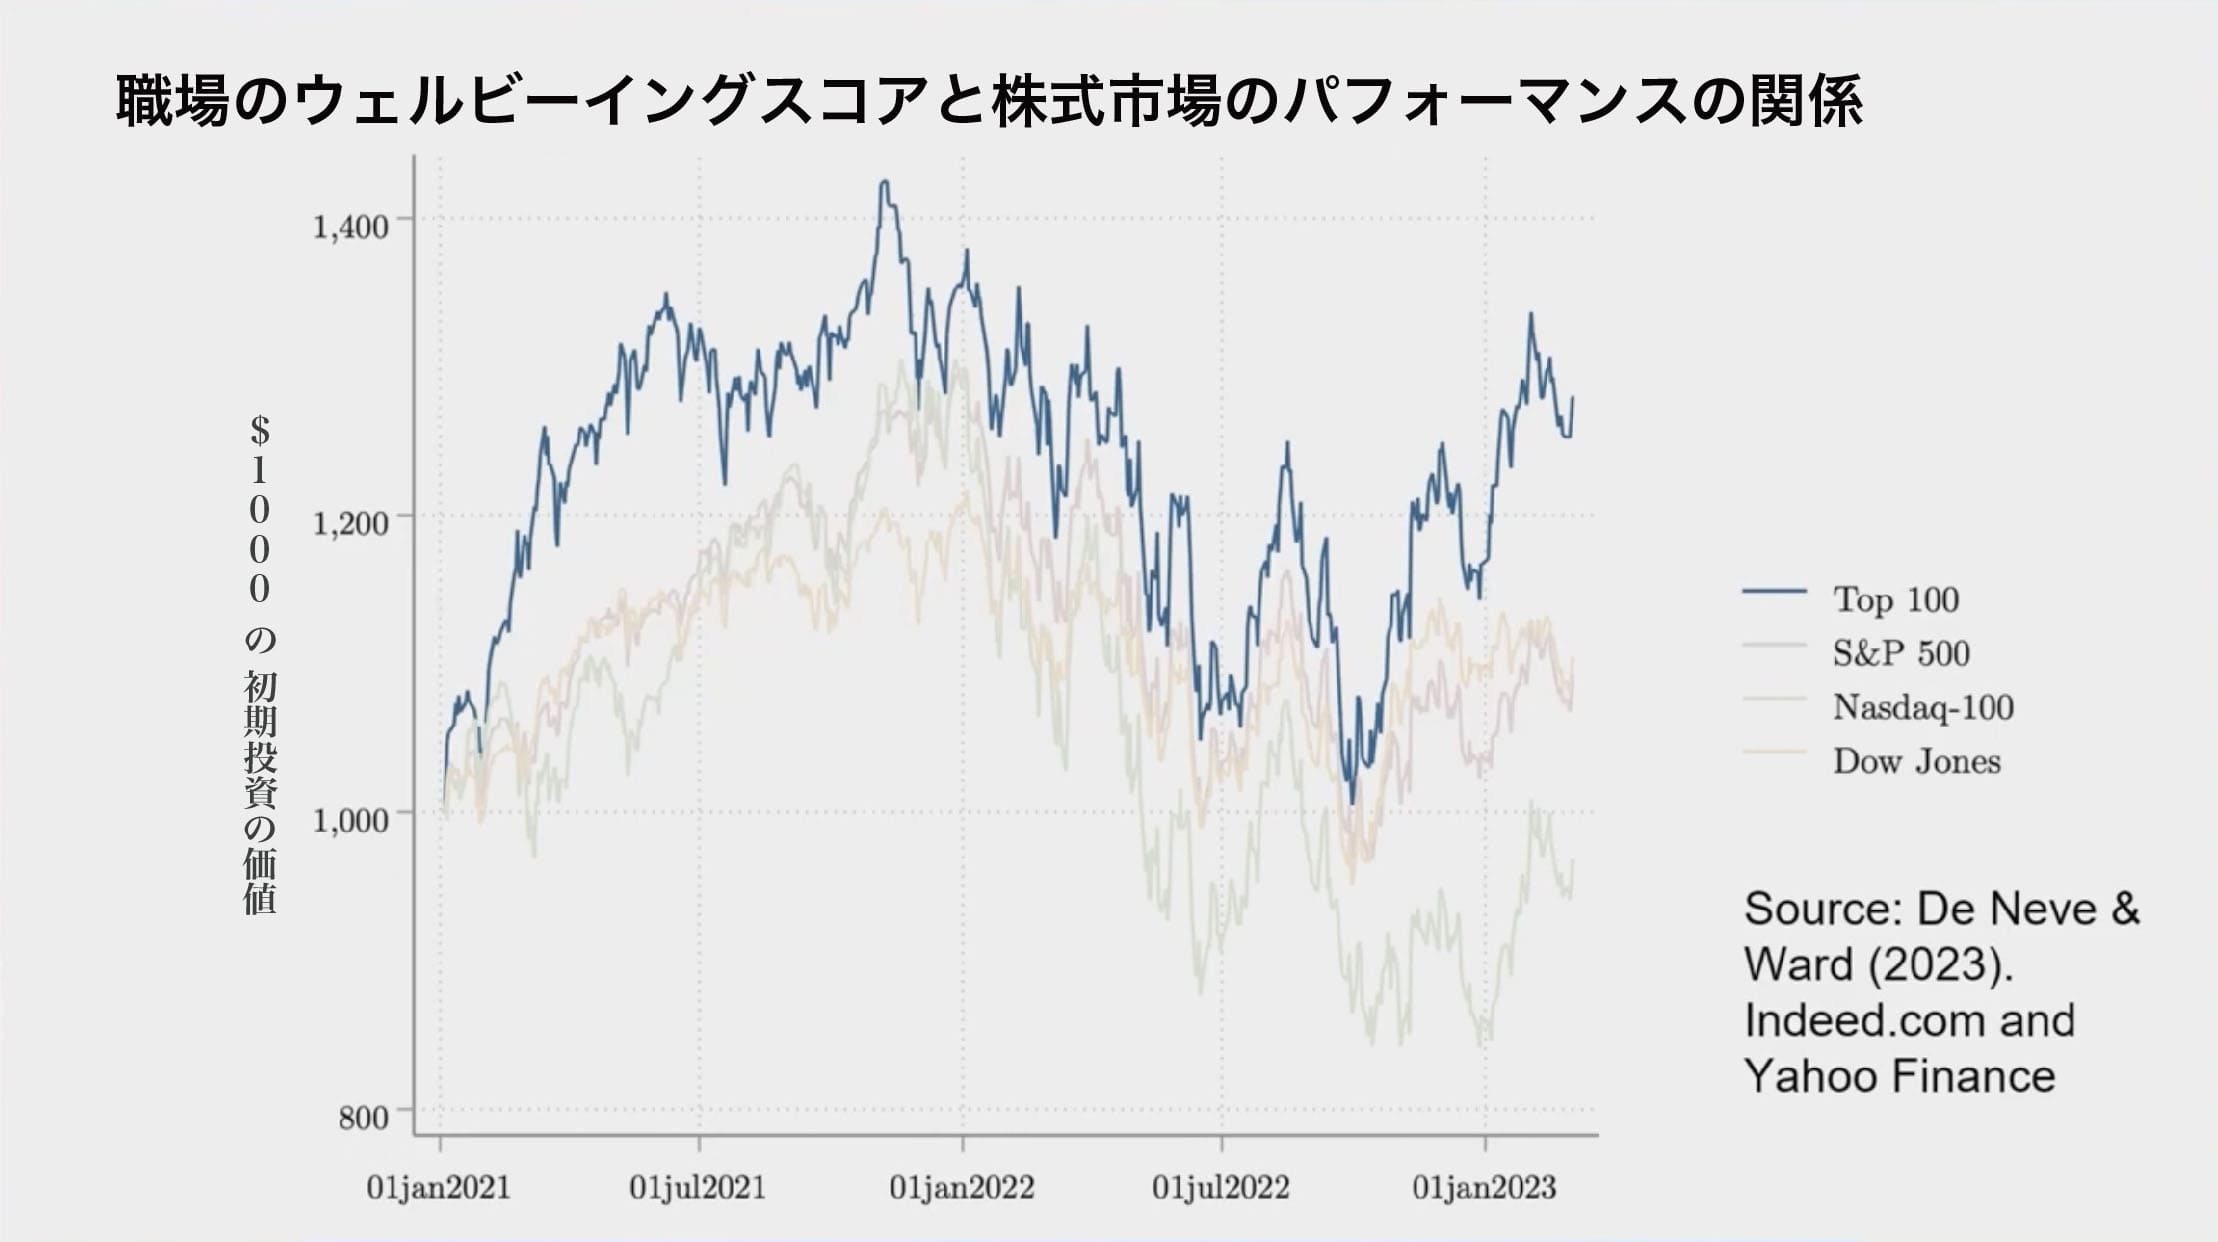
単純に2020年のデータをもとに従業員の感情の上位100社を選び、2021年1月1日に10ずつ投資し、1年後に見返してみます。ブルランでは高いウェルビーイングを持つ企業が指数を上回り、ベアラン(Bear Run: 株式市場や投資市場が一定期間にわたって価格が下落し続ける状況)では高いウェルビーイングを持つ企業が耐性を持ちました。
2023年の初めの数ヶ月、非常に不安定な時期においても標準的な指数に比べて非常に優れたパフォーマンスを示しています。明らかに、職場での人々の感情を通じて得られるデータには何らかの要素があることが示されています。これは、非常に主観的でフワフワしたデータです。
それは、非常に予測力が高いように見えます。株式市場が必ずしも捉えていない何かです。実際、これを具体的な数字で示したいと思います。
現時点では、私たちのポートフォリオは約1300ドルの価値があります。つまり、約30%のリターンです。これを、標準的なS&Pに投資した場合と比較してみてください。
正直に言って、現時点での私たちのポートフォリオのリターンは、S&Pに投資した場合の2倍以上です。また、テック株にしか投資しなかった場合より遥かに高いです。これは素晴らしい成果だと思います。けれども、私はまた、善良な理由から職場のウェルビーイングに投資すべきという事実にも気付いています。なぜなら、それが正しいことだからです。

6. 未来への希望
CEOやCFOを納得させるためには依然として具体的データが必要なことも確認されています。実際、私たちの調査によれば上級管理職の87%が、職場のウェルビーイングへの投資や高いウェルビーイングが競争優位性を持つと信じています。
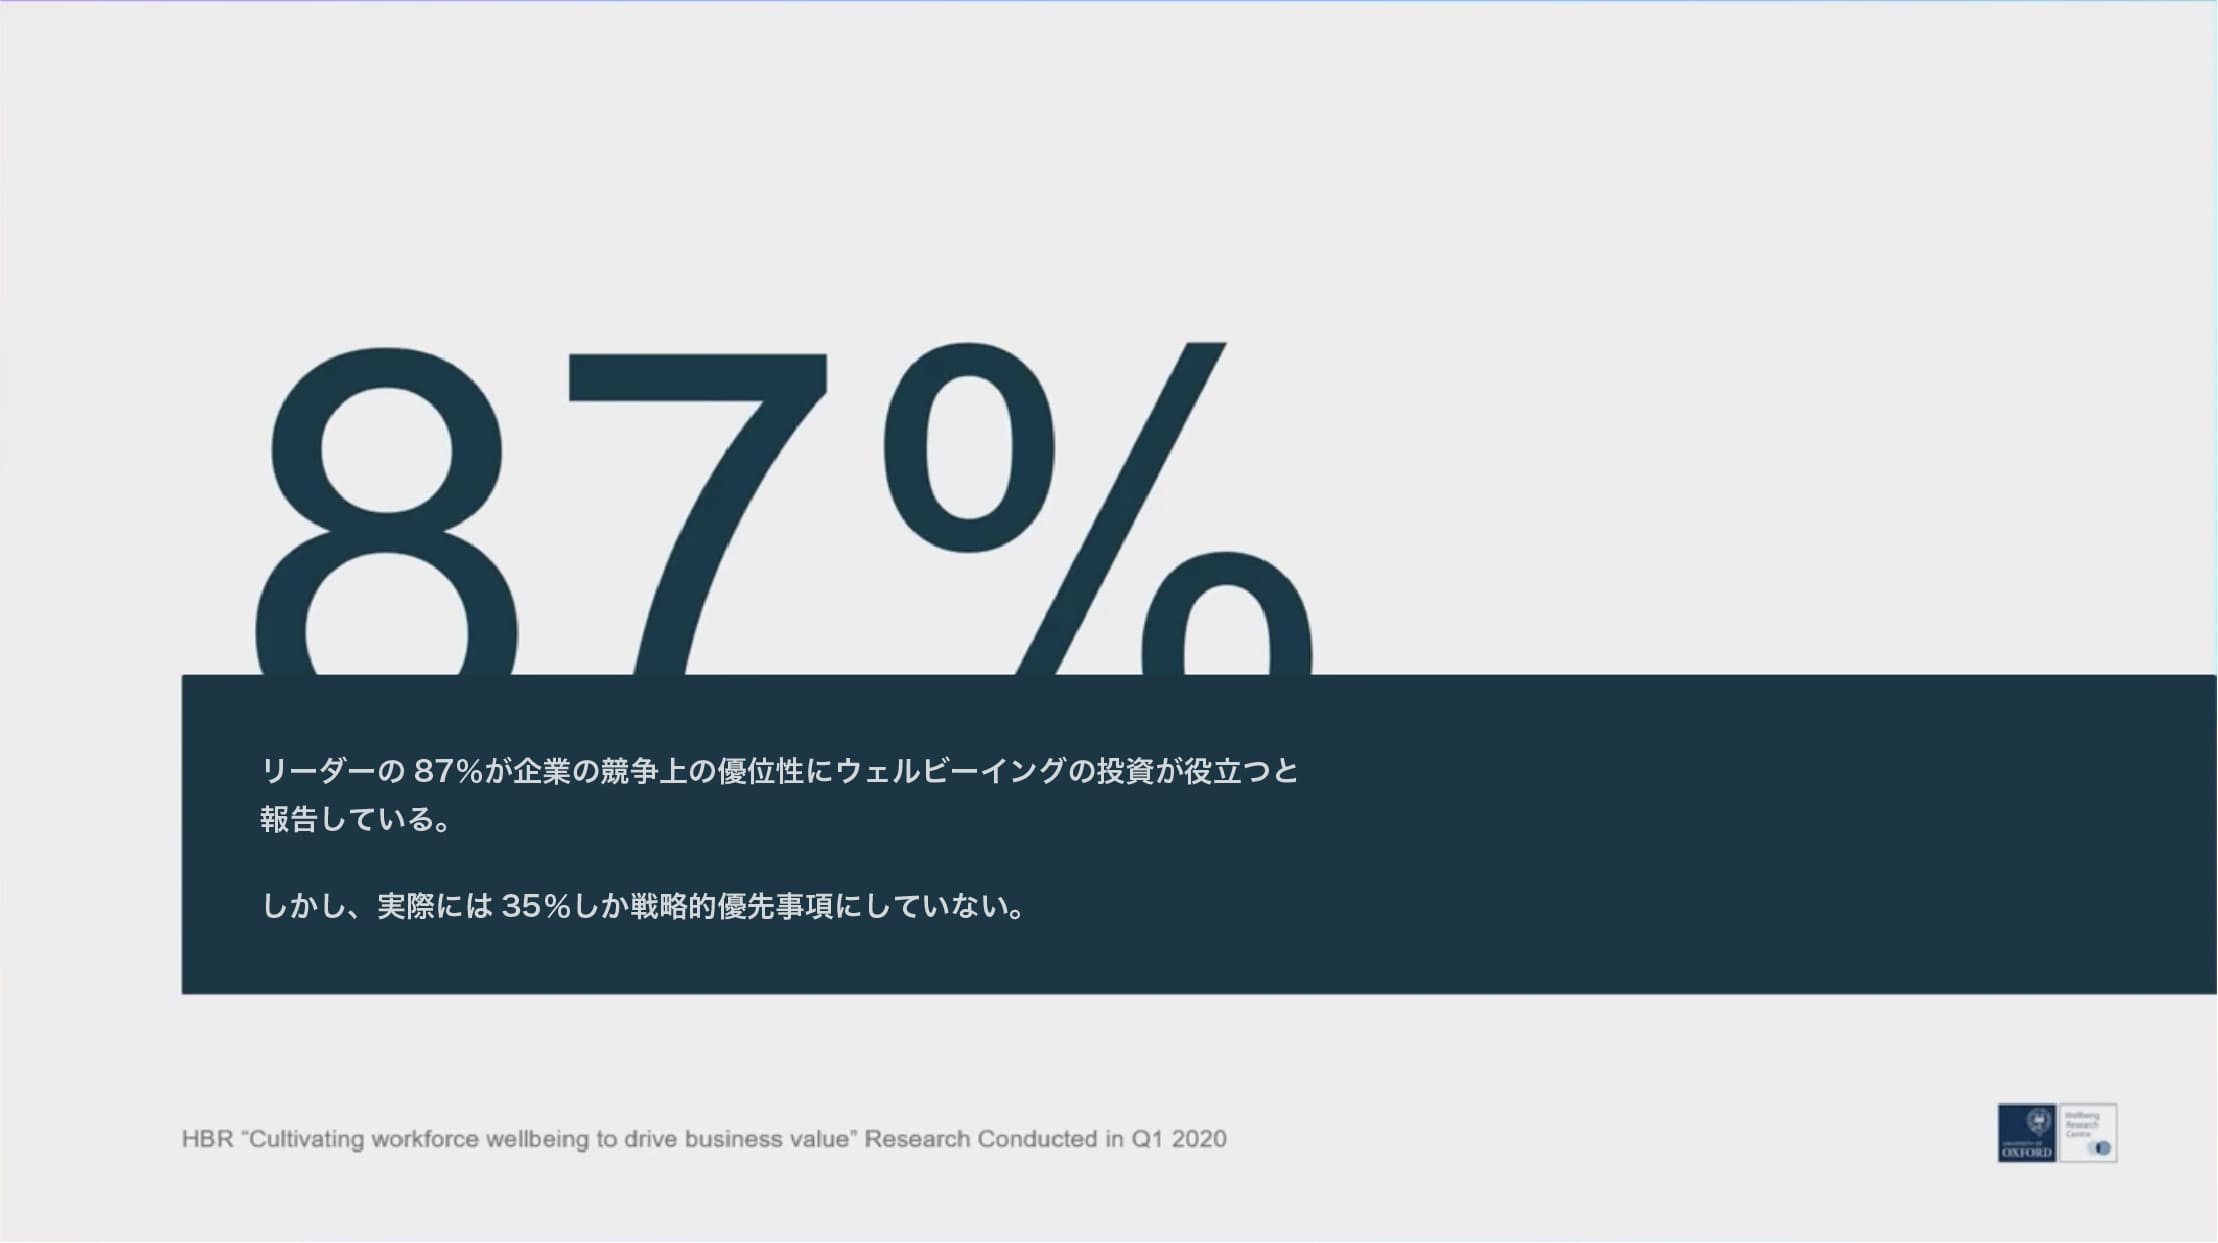
けれども、悲しいことに、これが戦略的優先事項に位置づけているのは約35%にすぎません。私の希望は、科学的側面での私たちの努力が、こうした議論の際に皆さんの納得に役立つことです。1年後または2年後、次の@WOHASUに戻ってときには、35%ではなく45%になることを願っています。そして5年後には80%、10年後には100%のリーダーが職場のウェルビーイングを戦略の中心に位置づけてくれること、データがそれを可能にすることを願っています。
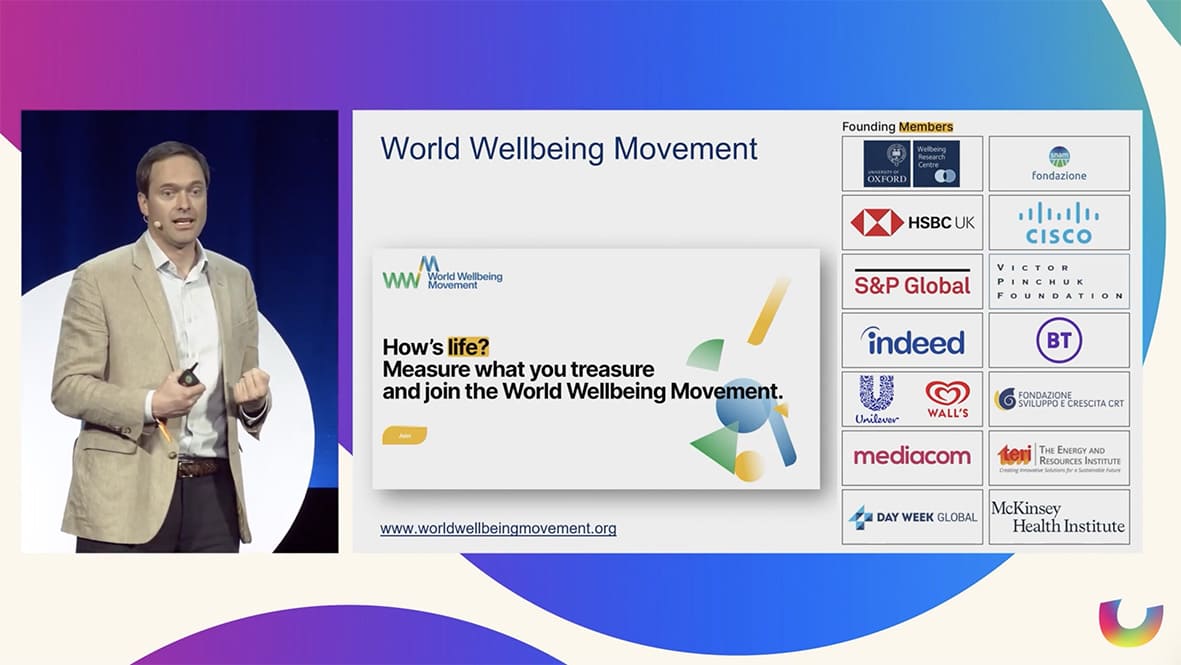
私たちは皆一丸となり、ウェルビーイングがビジネスや政策立案の中心に位置するよう努力する必要があります。そのために私たちはWorld Well-being Movementを設立し、素晴らしい模範的企業、運動、財団を引き寄せ、私たちの使命である計測の重要性を共有しています。
何が計測されるかが実行されるものですから、私たちの使命は計測することです。どうもありがとうございました。
2. 英語(English)
Thank you, thank you for those kind words of introduction. It’s just so great to be here with you today and to be able to share some of the insights of the world’s largest study of workplace well-being. We’ve been studying and running this project for the last three years, and I’m going to structure the insights that have come out and the learnings that we are seeing around four empirical questions that I’ve put on the screen behind me. So, we’ll start by asking, how do we measure workplace well-being in practice? How do we do so at a scale never seen before? What do the data tell us about what seems to be driving how people feel at work and their relative importance.
I will also touch upon our research on how employee well-being matters for productivity, how it matters for attracting talent, how it matters for retaining talent, and I will also try to find the time in the next 20 minutes to then bring it all together to see how employee well-being could also influence company performance at an organizational level. I will apply market’s financial market results as well as stock market performance for this. As you can tell, we’ve got a lot to go through in the next 20 minutes. I’ve prepared a lot of material for you in very little time, so if it feels like I’m rushing you through all of this material, then that’s probably because I am rushing you through this material. Please bear with me, but I hope that throughout these two wonderful days here in Coma, we’ll get to speak and deep dive even further into some of this material.
I’ve also made sure, as it bestows and a proper academic, to put the references on each slide in case you want to dig a bit deeper into some of this material. Most of which is online or about to be published soon enough.
All right, without further ado, let’s get started by asking ourselves the question: How do we measure workplace well-being in practice? Well, there’s only one way of doing this, which is by asking people. And the way we ask it in this world’s largest study is by asking them about how people feel: whether they feel happy at work, whether they’re content and satisfied with their job, whether they experience negative stressors or not, and whether they find purpose at work. Those are the four items that we’re asking, and that together give us a holistic picture of how people feel at work.
The aficionados in the room, most of you, will probably recognize that these four items mirror the consensus when measuring general well-being as proposed by the OECD, and especially the four items that the UK offers for national statistics to measure general well-being in the population in England and the rest of the United Kingdom.
I also want to emphasize the importance of conceptually distinguishing the outcome measure of well-being: how people feel at work, from what makes them feel the way they do or why they feel the way they do. Those are better considered drivers.
So when we’re thinking about social connections, managerial support, or fair pay, those are the drivers you should consider that will hopefully positively influence the outcome measure of workplace well-being. I also want to emphasize the importance of conceptually distinguishing the outcome measure of well-being: how people feel at work, from what makes them feel the way they do or why they feel the way they do. Those are better considered drivers. So when we’re thinking about social connections or managerial support or fair pay, those are the drivers you should consider that will hopefully positively influence the outcome measure of workplace well-being, which is how we feel at work. And you’ll see just how important all of this is.
Now, how do we measure this at a scale never seen before? Well, you need an incredible partner, and this partner is indeed the world’s largest job search platform. There’s about 250 million people each month going onto the website, and it’s that traffic that we can use to crowdsource, and that’s obviously the key to doing things at scale: to crowdsource surveys and responses to the items that I’ve just put on the screen.
The result of this massive effort in the span of less than three years, we’ve crowdsourced over 15 million company reviews. So individuals telling us how they feel about their employer, or working at their employer, or their previous employer. This is across multiple markets, about 20 markets at the moment, but most data is available for the United States. And that’s the kind of data that I’ll be using today. And this gives you a sense of what it looks like.
These are the questions being shown, and I’ll dig into it later. We don’t just ask for well-being outcome measures; we also ask a whole host of drivers, and I’ll talk about that in a second. So what do we find just roughly descriptively? Well, huge variation in employee well-being across companies, across industries, across job types, across regions, and I’ve just put some examples here on the screen. And you do need to realize that this world’s largest study of workplace well-being, thanks to Indeed, is the first time we can compare pretty much all major corporates in the exact same way, and that it’s never been able, we’ve never been able to do that before.
So when we take, for example, the companies in a very standardized industry, which is flipping burgers, hamburger fast food chains, you’ll find that even in such a standardized place of work, you’ll find huge variation in how people experience work, how they feel at work, and whether you’re measuring it through job satisfaction, workplace happiness, a sense of purpose at work, or stress, room the absence thereof. It is consistently that these differences show up. So look, for example, at McDonald’s versus In-N-Out Burger, which the Americans in the room will be very familiar with, especially if you live on the West Coast. So that’s that, but the data is so rich that we can dig even deeper.
We can go within companies, so the large companies we have tens of thousands of responses for reviews from their employees, current or past. And so what you’re seeing here is one example of Walmart, where we can see that there’s huge variation even within the company. So between warehouses, stores, units, you’ll find massive difference. And I think one key insight coming out of the data so far is that let nobody tell you that it is not possible to improve workplace well-being.
Because whether we find in the data wonderful places to work where people are happy to work in tough regions, in tough industries and even within companies that may not be performing super well, you’ll find units that are doing well and are leading by example to really show the way forward about creating a great place to work. So please, please, please do remember that. All right, onto the drivers outcomes is what we just looked at. Let’s dig in the drivers, and here I want to pause and also give you a moment for reflection.
If you look at possible drivers of employee well-being, we can think of a sense of belonging, being paid fairly, a sense of inclusion, diversity, supportive management, trust, learning on the job, and possibilities for career progression and achievement. Which one of these items do you think matters most to you or to your teams? That’s the quick intellectual exercise you should be doing now, and it is an exercise that we asked of about 4,500 managers and workers around the United States. And what they came back with is sort of a rank order of what they think matters most in driving their employee well-being at work.
What comes out is first and foremost, and this pleases the neoclassical traditional economist, fair compensation for the work we do. And then comes flexibility and appreciation, and so on and so forth. This is the rank order that people think matters most for workplace well-being. But then when you actually run the analyses and see what actually correlates most strongly with the outcome measures of how we feel, we find that being paid fairly is important but it falls to the middle of the pack. And what comes all the way on top is a sense of belonging, something that people didn’t quite think of as important as some of the other items.
And if you, in your intellectual or mental exercise, didn’t put a sense of belonging at the very top or near the top, you are not alone. In fact, only six percent of managers will have put a sense of belonging at the very top of what seemed to be most strongly correlated with your revealed workplace well-being, and only 34 would have put it in the top five. A sense of belonging is a difficult driver to define, but when we dig a bit deeper, we would define it as feeling like the company cares about you as a human being, having friends at work, and sort of knowing the impact of what you’re doing at the company on others within the organization. That’s sort of a definition or a sense for what belonging means. So it’s essentially your social capital, your social ties, and a sense of belonging.

All right, onto does well-being matter for productivity, recruitment, and retention, and I’ll start with the study that has taken us the most time, many, many years to be precise. Um, seven years to be even more precise. And it’s a study that required yet another partner. In this case, British Telecom (BT), as it’s known in the United Kingdom, the largest private sector employer. We studied all of their call center employees and we asked them on Thursday afternoons, “How happy do you feel this week?” And then they responded on the smileys from one to five, and then it disappeared a bit like a calendar invite. And this was the start of a major project, but we’re very pleased to say that we think we’ve nailed, for the first time, the causal link between how we feel as individuals and how productive we are. Because we then matched these employee well-being data from week to week to week with very granular performance data of these call center workers, and there are incredible levels of data available about them.
Let me start by giving you a general sense for the results that came back to us. These are the 20 or so call centers spread around the UK. And what you’re seeing on the horizontal axis is the average weekly employee happiness that was reported in those call centers, and on the vertical axis, what you’re seeing is the average weekly customer satisfaction coming back. So, this gives you a first correlational sense for how people feel in the workplace, seems to be correlating very strongly with how customers perceive the quality of the job being done.
But really, where we dug a lot deeper and where it took us a lot more time is to look at the individual link. This is where call centers are interesting because we can measure individual well-being and tie it to individual performance. And what we find here, and the headline result for this study is essentially that for a one-point change on a scale from 0 to 10, we found a 12 percent increase in weekly sales. And we have many other metrics of performance, but that’s kind of the headline result that was picked up in the media.
Now, why is it that there was such a strong causal effect of how we feel from one week to another to how we perform from one week to another?
It is because, not because people work longer hours or put more effort in, etcetera, no, it was because they were just working better. Um, we found that they had a heightened sense, or it activated more of their social-emotional intelligence, and that translated just into getting more conversion, in terms of the calls. I’ll give you an extreme example, which would be if a disgruntled customer called in; well, people who felt better that week were way more likely to be able to retain that customer than otherwise would have been the case. And so, it was really powerful to see the impact and the pathways through which and why there was such impact.

All right, that’s, we can talk a lot more about the BT study, but let’s move on to the second pathway, why I think there’s an impact on overall performance, and that is through recruitment. Better places to work are also better at attracting talent, something that is incredibly top of mind for most business leaders these days.
And here, I have to point to the exceptional work by my colleague George Ward, which is, this is now just online, it’s been published as an MIT working paper, and it will hopefully come out very soon in a top peer-reviewed journal. He’s been able to nail, for the first time, and provide causal field evidence for a good workplace being able to attract better people. And the way he did it was to show on the job search ads information about the workplace, thanks to the incredible data gathering effort of Indeed. And so, by randomizing 24 million job seekers into seeing or not seeing what a great place to work is, we found, or he found, that there’s an effect on people’s job search behavior.
So, people migrate their job seeking away from less good workplaces to better workplaces. So, whether it’s through word of mouth or through amazing crowdsourced efforts on Indeed or Glassdoor and the likes, people are starting to change their behavior in function of whether it’s a good place to work or not.
It’s a good place to work or not. It’s a good place to work. Okay, the third channel through which employee well-being may impact the performance of companies is through retention. This is another company, Glassdoor, and there are a number of ways of showing this relationship, but this, I thought, was pretty cute and will resonate. The same thing here: you can measure whether people go out and apply for other jobs, depending on or in function of whether or not they’ve given high or low ratings for the company they currently are employed at.
So, essentially, people are twice as likely to go out and look for another job and literally apply for other jobs within the space of a week if there’s twice as, I mean, if they’re much lower in terms of the rating that they give. So, two out of five will lead people to really apply twice as likely that week for another job than a five out of five. So, there’s a lot of cumulative evidence coming through that really suggests that there are pathways through which this works.
And you see, over the past seven, eight, nine years, we’ve been working on lots of research projects that together are starting to give a very empirical, strong picture around what it is—workplace well-being. So, how do we measure it? What drives it? The relative importance of these drivers and how they change over time—pre-COVID, COVID, post-COVID. And then, on the other hand, the outputs—what it seems to impact on the business side. So, does it improve productivity? Does it help you attract talent? Does it help you retain talent? And what does it do to your cost of capital in terms of your opportunity to raise investment?
And there’s more to come on that front. So, you’re seeing we’re working really hard to try and put it all in one massive holistic model that will hopefully be very useful to you. And, as I hope, once we release this, okay, what I haven’t told you as of yet is how do these four channels, these four pathways through impacting performance, do they leverage and scale at the organizational level? Because one thing that people tend to forget when they say, “Oh, a happy worker is a more productive worker,” well, yes, but what does it take to make a workplace a happier workplace? There’s a certain investment to be made, and is the net benefit positive or not? And the only way to find out whether these pathways all lead and come together in a net positive outcome for the company is by bringing them all together and running analyses between employee well-being at the company level and the financial performance of stock market performance.
And that’s what the world’s largest study has now finally allowed us and been able to do. So, the proper business case, if you will, for investing in employee well-being, I think, is now only for the first time been properly made, and I’m very keen to share some of the results with you. The first set of results are on financial performance. What you’re seeing behind me are U.S companies that are stock listed. There’s about 700 of them for whom we have sufficient data, crowdsourced through indeed, to tell us how people feel at those companies. And obviously, stock-listed companies have to report all of their financial performance metrics every quarter in a very standardized systematic way. And that’s the data that we use and match it with the employee well-being that gets reported to us in those same quarters.
And what you’re seeing behind me is that there’s a very strong correlation between how people feel at the company and the firm’s value, the return on assets, and the gross profitability of an organization.
It’s correlational. We’re digging much deeper into these data to also see the predictive power of it. But I do think that one thing that you’ll really appreciate is what we’re about to show you next, which gives you a sense of that predictive power in terms of the stock market performance. What you’re seeing behind me are simply the standard U.S. indices: the S&P 500, the NASDAQ top 100, and the Dow Jones. It went up during the Bull Run of 2021, came down significantly in 2022, and has been very volatile at the start of this year, in the months of January, February, and early March of 2023.
Now, imagine that you could invest in a portfolio just made up of the world’s best workplaces, or at least, in the context of the United States, the best workplaces. Well, thanks to this massive crowd-sourced data set that allows us to compare all these companies, especially all the large ones that tend to be stock-listed and available in the stock market, that’s exactly what we’ve done. So, I’m about to show you essentially the returns on a portfolio just based on listening to workers and how they experience the workplace and investing on that basis.
This is how we’ve done in our stock market portfolio. This is simply by taking the 2020 data on how people feel, putting the top 100, but we can play around with top 50, the top 10, the top 150, whatever you want to do. But here, for the sake of simplicity, the top 100 companies out of the 700 or so that we have access to that are stock-listed. And what we’re seeing is essentially that the 2020 data rank order, take the top 100, and then invest $10 in our little portfolio at the start of 2021, on January 1st, 2022, and then go back to bed, wake up about a year later, and see what’s happened.
In the Bull Run, the well-being companies outperformed the elder indices, and during the Bear Run, where there are high levels of well-being, companies were more resilient. And in the very volatile first few months of this year, we see that we’ve really, really outperformed compared to the standard indices. So, clearly, there’s something to it. It is very subjective, fluffy data that comes back through how people feel at work.
It seems to be highly predictive of something, and something that the stock market doesn’t necessarily pick up on. In fact, if you really want to put numbers on this, right now our portfolio would be worth about a thousand three hundred dollars. So, that’s about a thirty percent return. Compare that with what you would have gotten if you just invested in a standard, in the S&P.
To be honest, it’s more than double at this stage than you would have done in the S&P, and a lot more if you had only invested in tech stocks. So, this is wonderful work, I think. But I’m also acutely aware of the fact that we should invest in employee well-being in good workplaces for its own good reasons, because it’s the right thing to do.
However, I’m sure that you have also encountered conversations out there where it still takes raw hard data to convince a lot of CEOs or CFOs to make the investment. Because most of us, and even leaders, in fact, 87 percent of senior managers, believe that there’s a competitive advantage to investing in workplace well-being or having a high workplace well-being in your organization. But the sad truth is that, as has been revealed also in discussions earlier today, only about 35 percent have actually made it a strategic priority.
So, my hope is that our hard work on the scientific side will help you all make the case when you have these discussions. And that it’s not just 35 percent, but in a year or two when we come back for the next WAHASU, it’s at level 45. And five years from now, it’ll be at 80. And hopefully, 10 years from now, a hundred percent of leaders will have put workplace well-being at the very heart of their strategies.
nd I hope that these kinds of data will make it possible. Another thing that we all need to do is to come together very strongly and put our shoulders behind making sure that these metrics are at the heart of business and policy-making. And that’s exactly what we’ve been trying to do, setting up the World Well-being Movement and attracting wonderful exemplary corporations, movements, and foundations to put their shoulders behind this mission of measuring what you treasure, because what gets measured gets done.
And so, with that, thank you very much.


[…] ジャン先生の素晴らしすぎる講演です!貴重な講演のシェアを本当にありがとうございます。日本語訳を紹介させていただきます。👉 【職場のウェルビーイング】世界最大の研究から得た洞察 […]